 OSU Pytheas - Data Catalog
France
Type of resources
Available actions
Topics
INSPIRE themes
Keywords
Contact for the resource
Provided by
Formats
Representation types
Update frequencies
status
Scale
-

In the framework of the SNO/SOERE MOOSE (Mediterranean Ocean Observing System on Environment https://www.ir-ilico.fr/Les-reseaux-elementaires/Fiches-d-identite-des-reseaux-elementaires/MOOSE ) program, the Mediterranean Institute of Oceanography is operating coastal High Frequency Surface Wave Radars (HF radar) on the North Western Mediterranean coast. This activity is also supported by the following European Research Infrastructure Jerico-Next (https://www.jerico-ri.eu), and Intereg MED programs as Impact and Sicomar +. HF radar provide high resolution (3-5 km), synoptic view of surface currents from the shore up to 80 km off shore at hourly time scales. The measurement principle is based on the Doppler effect created by an additional current on the intrinsic speed of the waves selected by radar-sea interactions, called Bragg waves, having a wavelength of half that of the radar e.m. waves and propagating in the axis of observation (radial currents). A single radar scans the sea in azimuth and determines the radial components of the current at each adjacent cell along each azimuth. Two separate radars for the same area from different angles then collect the information necessary for mapping vector current from the combination of the two sets of radial components. The HF radar data set is made of monthly averaged surface currents, geo-referenced on cartesian lon/lat coordinates. The radial velocities maps are provided applying a Direction Finding technique (instead of traditional Beam Forming) not only to the full array of antenna but also to subarrays made of a smaller number of sequential antennas, a method which we refer to as "antenna grouping". Radials from Peyras-Peyras and Porquerolles-Benat are computed to reconstruct the vector field.
-
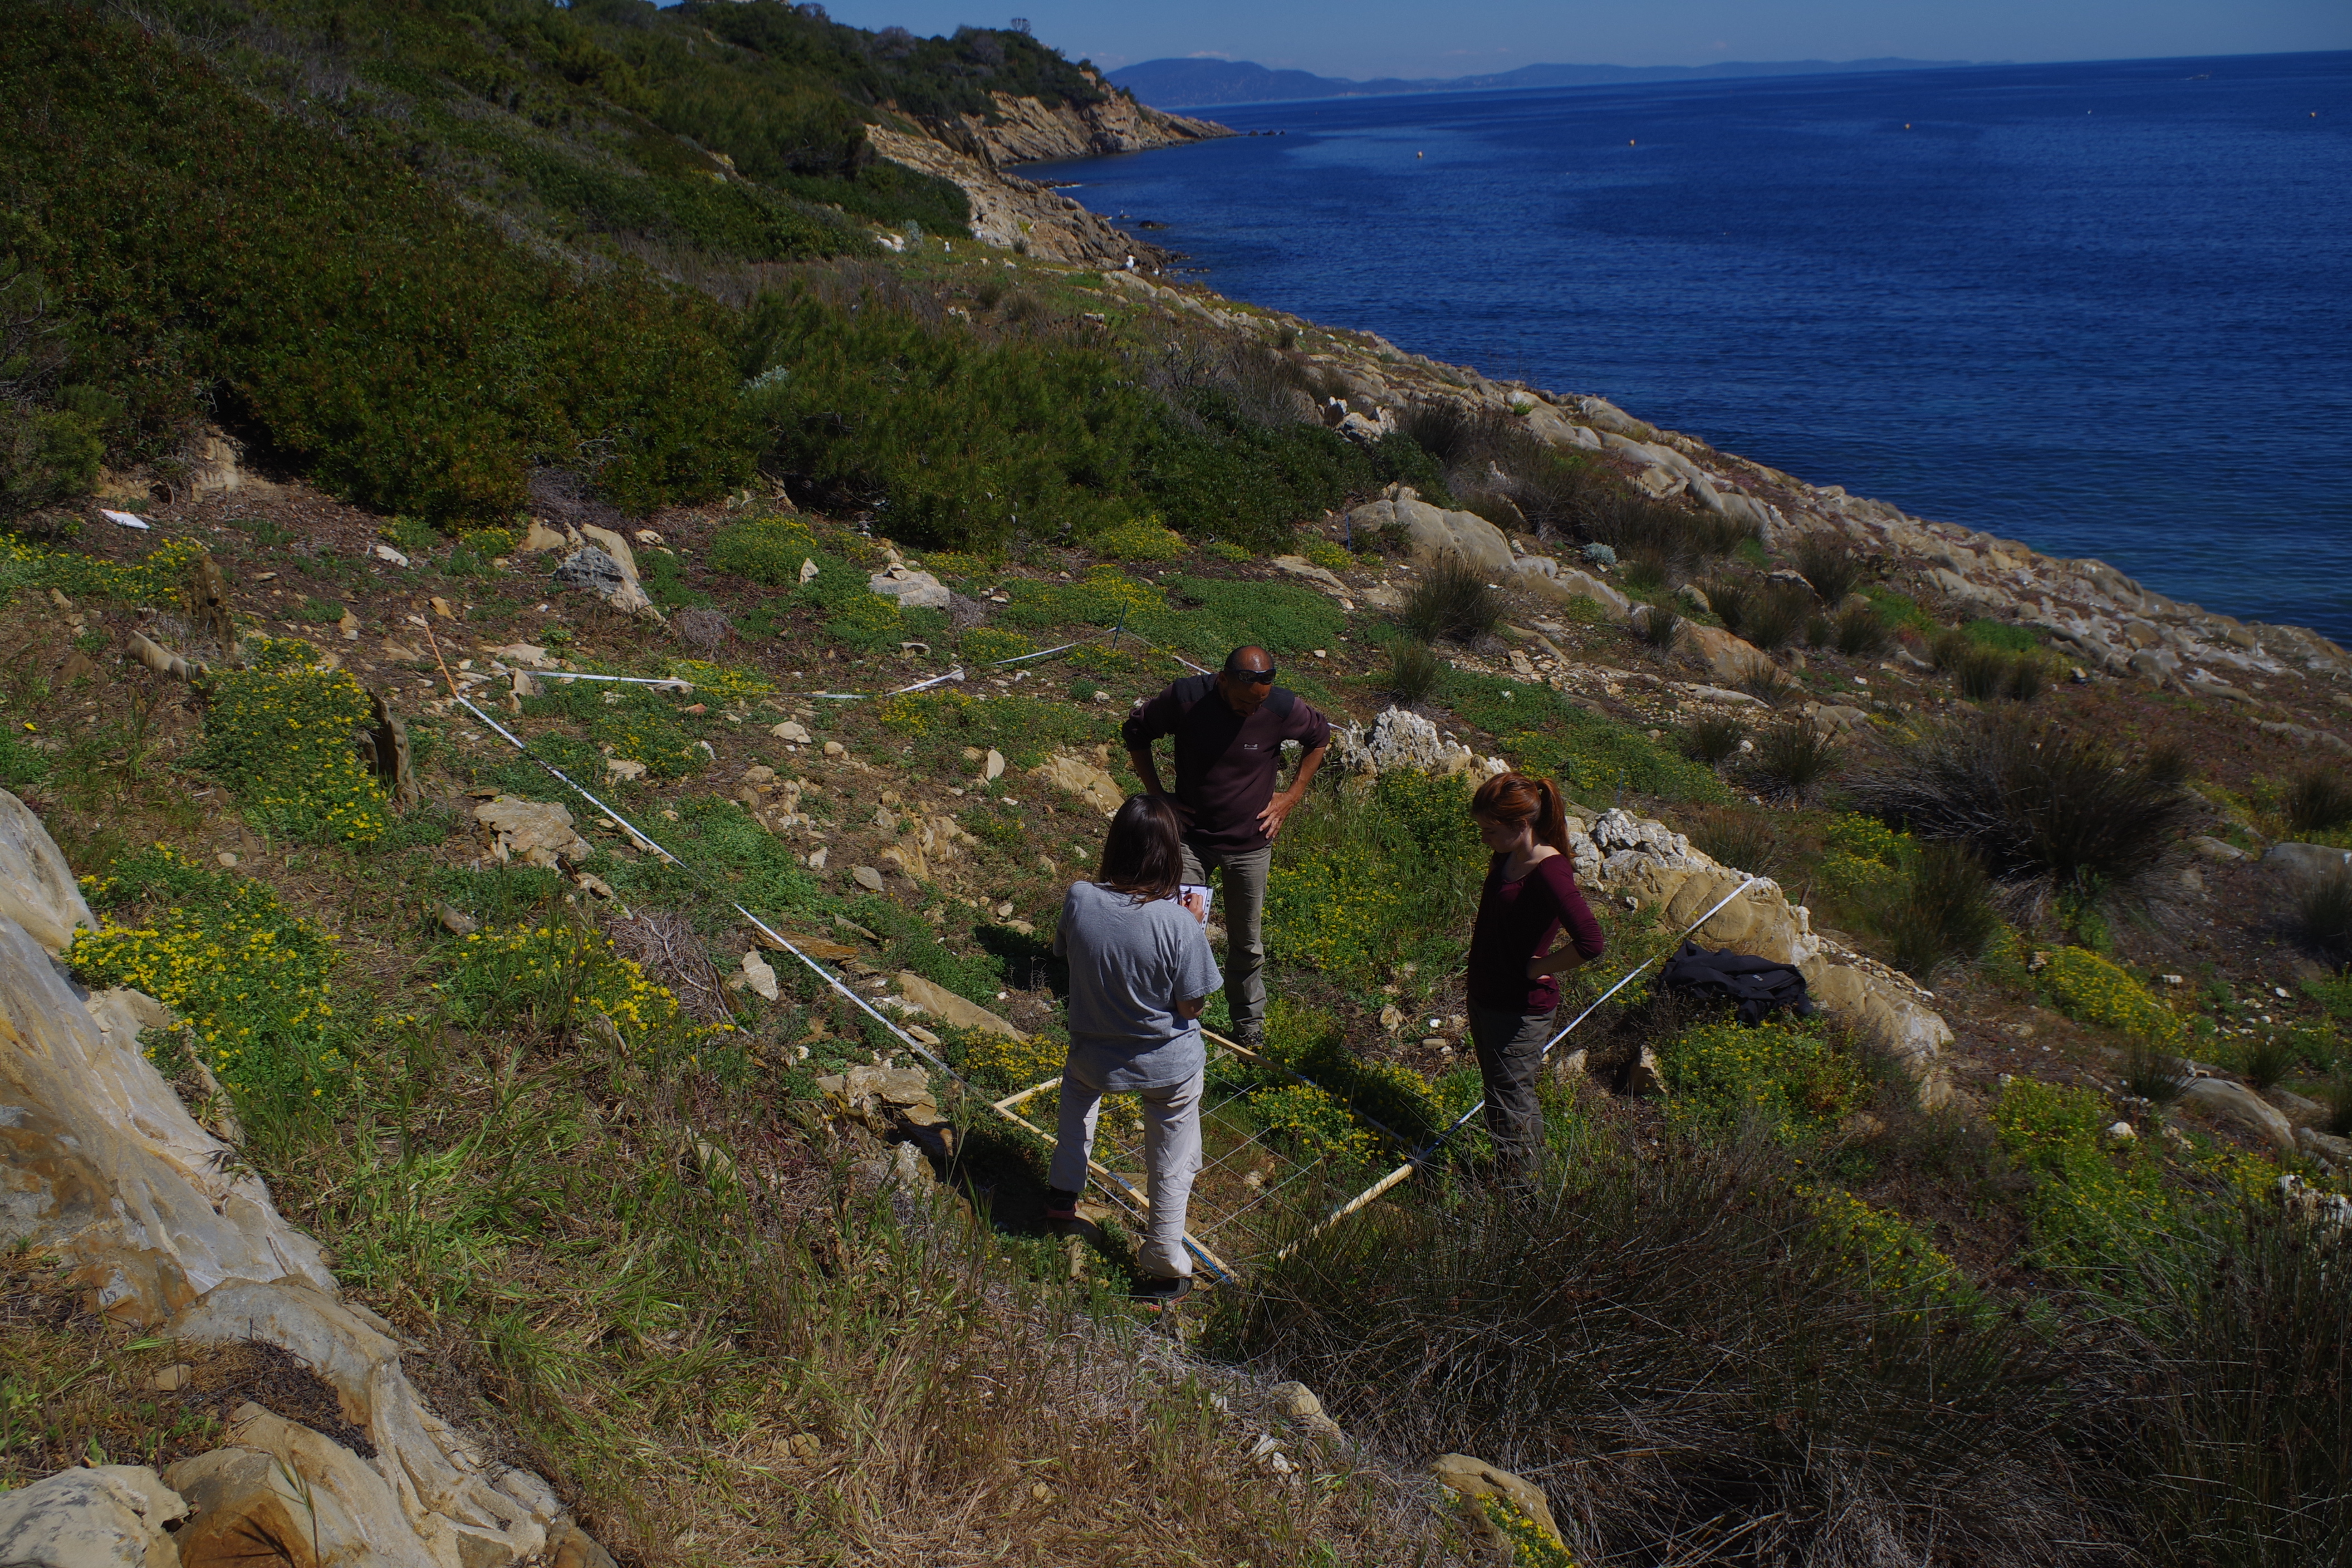
L’île de Bagaud, réserve intégrale du Parc National de Port Cros (PNPC), fait actuellement l‘objet d’un programme décennal de restauration écologique en vue de la préservation de son patrimoine naturel. Cette restauration consiste à contrôler deux espèces exotiques envahissantes : le rat noir (Rattus rattus) et la griffe de sorcière (Carpobrotus sp.). Débuté en 2010, ce programme permet l’étude de plusieurs groupes taxonomiques avant (2010-2011) et après contrôle (2013-2019) : (1) la flore, (2) les arthropodes épigés et les insectes volants, (3) les squamates, (4) les oiseaux terrestres nicheurs et (5) les oiseaux marins nicheurs. Ce projet fédère une large communauté d’acteurs académiques et non-académiques autour d’un objectif commun : contrôler et si possible éradiquer les espèces invasives de la réserve intégrale et suivre la résilience des groupes taxonomiques cités ci-dessus. Partenaires pour le suivi et l’analyse des données : IMBE, PNPC, CBNMed, association Reptil’Var, association DREAM et LPO. Autres partenaires : PIM, INRA, Conservatoire du Littoral, Domaine du Rayol, Naturoscope, UE, Natura2000, TLV, Région Sud, Naturalia Consultants en Environnement.
-
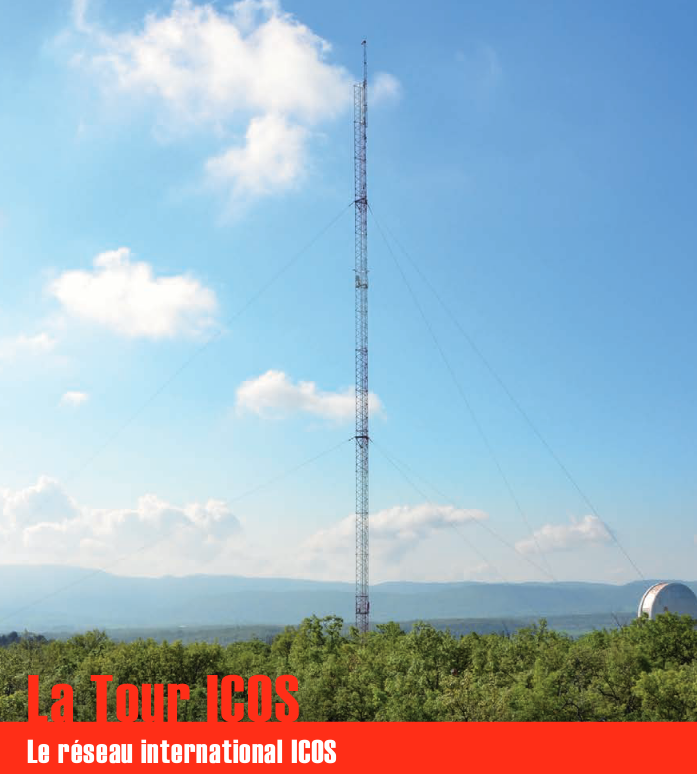
Une infrastructure de recherche européenne de mesure des concentrations atmosphériques des gaz à effet de serre et des flux de carbone sur les écosystèmes et l’océan. La tour ICOS (pour Integrated Carbon Observation System) installée à l'Observatoire de Haute Provence (OHP), haute de 100 m est une antenne régionale du dispositif permettant d’étudier la place de la forêt méditerranéenne dans le bilan de carbone. Elle est équipée d’instruments à trois niveaux (10, 50, 100 m). Le réseau est doté de 3 types de stations réparties sur le territoire : continentales, côtières et de montagne. Chacune de ces stations mesure les paramètres suivants : * température, direction et vitesse du vent, pression atmosphérique, humidité * CO2, CH4, CO, H2O * hauteur de couche limite atmosphérique (lidar) Les objectifs scientifiques de ce programme européen sont de : * tracer les flux de carbone en Europe et dans les régions adjacentes par observation des écosystèmes, de l'atmosphère et des océans à travers des réseaux intégrés, * fournir les observations à long terme nécessaires pour comprendre l'état présent et prévoir le comportement du carbone global et des émissions des gaz à effet de serre, * surveiller et évaluer l'efficacité de la séquestration du carbone et/ou de la réduction des émissions de gaz à effet de serre sur la composition globale de l'atmosphère, en prenant en compte les sources et les puits par région géographique et par secteur d'activité. L'infrastructure ICOS permet d'accueillir des chercheurs pour des campagnes de recherches
-
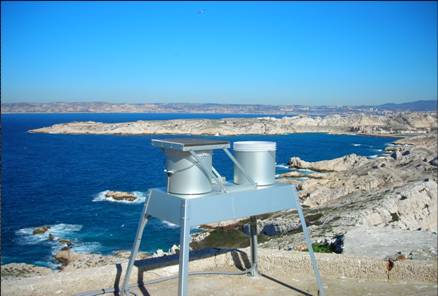
OBJECTIF – Mesures des flux de matières d’origine atmosphérique en mer Méditerranée dans le cadre du réseau MOOSE Mesures en réseau avec cap Béar et cap ferrat Le milieu marin est de plus en plus soumis à l’influence anthropique, très directement sur la frange littorale, mais également au large par les retombées atmosphériques qui peuvent se propager très loin. La Méditerranée étant une mer oligotrophe, c’est-à-dire pauvre en élément nutritifs, tout apport d’éléments peut être un facteur de développement biologique significatif. Par contre l’apport de contaminants et de polluants par voie atmosphérique peut être un facteur perturbant ou inhibant l’écosystème. Le site du Frioul offrant l’opportunité de quantité les retombées atmosphériques dans la zone côtière, le Service d’Observation du MIO a proposé d’utiliser ce site pour installer des collecteurs de retombées atmosphériques. Collecteur de retombées atmosphériques sèches et pluies (MTX Italia) installé sur une plateforme dans l’enceinte du sémaphore de Pomègues Un collecteur de type MTX permet de récupérer les retombées sèches et les retombées humides (pluies) séparément. Parallèlement, un système de pompage en continu des aérosols a été mise en place dans la pièce supérieure du sémaphore. Il est composé de pompes à vide reliées à un compteur qui aspire en continu l’air qui est filtré sur un filtre disposé à l’extérieur. La collecte des échantillons est assurée chaque semaine par un opérateur du MIO. Par ailleurs le MIO assure le traitement et l’analyse de la matière récoltée. Les éléments suivants, source de fertilisation du milieu marin sont déterminés : - Azote total - Phosphore total - Carbone total - Formes solubles de l’azote (nitrate, nitrite, ammonium) - Formes solubles du phosphore (orthophosphates) - Formes particulaires de l’azote, du phosphore et du carbone. SITE : Iles de Pomègues - Sémaphore du Frioul PROGRAMME DE RATTACHEMENT - Mediterranean Oceanic Observing System on Environment : MOOSE - Labellisation : SOERE - INSU - Financement : SOERE – INSU – Ville de Marseille RESPONSABLE LOCAL: - Patrick Raimbault DISPONIBLITE DES DONNEES : - Base de données SEDOO: http://mistrals.sedoo.fr/MOOSE/ PARTICIPANTS : - M. Fornier : collecte - V. Lagadec analyses chimiques - P. Raimbault : analyses élémentaires PARTENAIRES - MOOSE - CHARMEX- Ville de Marseille – Parc des îles du Frioul - OSU de Villefranche et de Banyuls
-

This Application is a simple calculator that estimates Turbulent Air-Sea Fluxes based on input variables such as wind speed, air temperature, or relative humidity. The input variables can be easily set by hand with sliders. The present Air-Sea Flux Calculator application makes it easy to get an estimate of the fluxes at Sea of for Educational purposes The code is a simplification of the well known bulk algorithm so-called COARE 3.0 (Fairall et al. 2003). The authors of this code are Nicolas Bourras and Denis Bourras (MIO CNRS UMR 7294, Institut Méditerranéen d'Océanologie, Institut Pytheas CNRS UAR 3470, Aix-Marseille University). Citation: Bourras, N., & Bourras, D., (2023). Air-Sea flux calculator [Application].
-
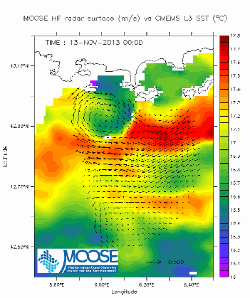
In the framework of the SNO/SOERE MOOSE (Mediterranean Ocean Observing System on Environment) program, the Mediterranean Institute of Oceanography is operating coastal High Frequency Surface Wave Radars (HF radar) on the North Western Mediterranean coast. HF radar provide high resolution (3-5 km), synoptic view of surface currents from the shore up to 80 km off shore at hourly time scales. The measurement principle is based on the Doppler effect created by an additional current on the intrinsic speed of the waves selected by radar-sea interactions, called Bragg waves, having a wavelength of half that of the radar e.m. waves and propagating in the axis of observation (radial currents). A single radar scans the sea in azimuth and determines the radial components of the current at each adjacent cell along each azimuth. Two separate radars for the same area from different angles then collect the information necessary for mapping vector current from the combination of the two sets of radial components. The MOOSE HF radar MEDTLN data set is made of daily averaged surface currents, geo-referenced on Cartesian lon/lat coordinates. Those are computed from hourly total velocity data of level L3B (velocity threshold and GDOP threshold tests passed) for which additional RFI outliers’ eliminations are made using a one inertial period (17h at 43°N) statistical method based on the number of L3B valid data, variance and mean over the 17h period by reference to the long term (full dataset) statistics. The associated quality control (QC) indexes for the hourly data range from 0 (missing or bad values) to 4 (best confidence values). Details of the method available on the MOOSE HFradar website. Velocities, variances and QC values in this file are those averaged on a lunar daily basis (25 hours average) centered at noon of each day. Hourly data for specific studies may be available on equest (see contacts below). DOI : 10.17882/56500 Landing Page = https://doi.org/10.17882/56500
-
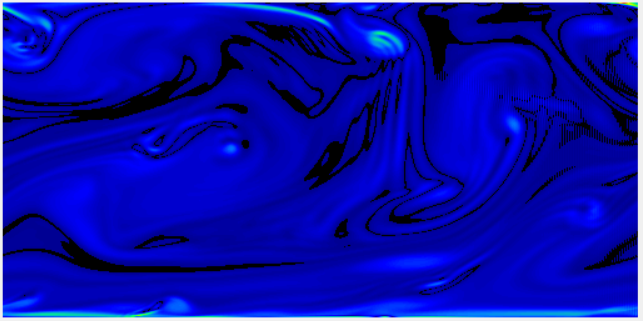
Wind is generated from left to right by an imposed constant horizontal pressure gradient. The initial wind field is disturbed by small random variations so as to produce a turbulent field. Withouth the perturbations, a viscous solution would be found. The numerical resolution technique used is based on finite differences, applied to a structured mesh. The Continuity and Navier-Stokes equations are solved with the well-known half time-step method, in which the Poisson equation is solved over the entire domain at each time iteration. As of 17 March 2022, the code version is DNS_2D_for_Teaching-v1.0.0. The code is written in C language. A GUI (Graphical User Interface) is available as an executable file "sdiapp.exe" that can be run under most versions of Microsoft Windows. Please just make sure to check the 'graph' box before clicking on the launch button, to have the visual experience. On the GUI, two graphs give an overview of the real time simulation. The top graph shows the 2D (x,z) vorticity, while the bottom graph shows the wind speed. The colour bars are not shown, but they are classical tables in which blue means small values, while red colours denote large values. The authors of this code version are Francis Vivat (LATMOS UMR CNRS 8190) and Denis Bourras (MIO UMR 7294). The code is distributed freely and comes with no garantees. It was mainly designed for educational purposes. Please note that the rules of use must follow the CeCILL-C FREE SOFTWARE LICENSE AGREEMENT included in the distribution. Any return is welcomed and encouraged, please contact francis.vivat@latmos.ipsl.fr or denis.bourras@mio.osupytheas.fr. Citation: Vivat, F., & Bourras, D., (2023). DNS_2D_for_Education [Application].
-
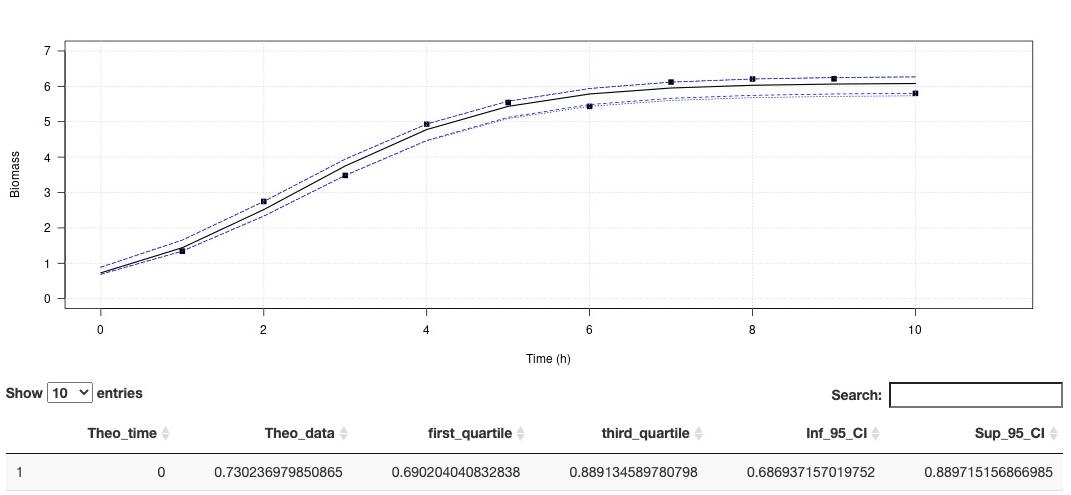
Environmental conditions are a set of physical and biological variables that define an ecosystem. Microorganisms with higher generation times than more complex multicellular organisms are more sensitive to changing environmental conditions. Therefore, microbial growth curves are an important and simple way to understand how environmental conditions affect microorganisms. Growth curves are used in a variety of biological applications. Traditionally in microbiology, the maximum growth rate (µmax) is calculated by fitting a linear model on data of the exponential growth phase. This method is simple to implement, and robust if the exponential phase contains many points. However, this method is very limiting when the curve is described with few points, as we have seen with experiments under high pressure conditions. In order to overcome this limit, recurrent in biology, we propose to use models to estimate growths parameters. Modeling has existed for many years to describe the growth behavior of microorganisms under variable physical and chemical conditions (Zwietering et al., 1990). Here we propose a ready-to-use application that do not require any special coding skills and allow retrieving several essential parameters describing microbial growth. his app aims at estimating the growth rate and maximum cells density using non-linear regression. The method is detailled in Martini et al. (2013). A demo dataset is available in "Download a demo dataset", you can save it in your computer and load it using "Browse", or you can also browse your own dataset. On Plot panel, it is possible to set axes labels, axes range and Smooth. Smooth parameter can compute theorical (downloadable) for to use with other activities. In order to run this application, you have to format your dataset with tabulation separators. Also, remove all spaces in the dataset header (prefer to use "_" when needed). Organise your dataset so that there is only two arrays. The first one being the time and the second one, the cells density (e. g. optic density, cell number, biomass). This application proposes a method to perform a logistic regression to estimate growth rate as well as maximum cells density . Citation: Garel, M., Izard, L., Vienne, M., Nerini, D., Tamburini, C., Martini, S. (2021). R-shiny-microorganisms v2 : A ready-to-use logistic regression implemented in R shiny to estimate growth parameters of microorganisms [Data set]. MIO UMR 7294 CNRS. https://doi.org/10.34930/DC1DAF1C-09E3-4829-8878-91D0BF0E643E
-
The Rochelec dataset gathers petrophysical and geoelectrical data from the Rochechouart impact structure (France). Since 2017, about 10 geophysical field campaigns were performed on this eroded structure. Among other techniques, geophysical downhole logging, electrical resistivity tomography and controlled-source audiomagnetotelluric data were acquired. In parallel, we measured the electrical resistivity and porosity of some core samples coming from drillings performed in fall 2017 at several sites of the impact structure. These multiscale electric data allows to better characterize the different lithologies outside the drilling sites, and their associated geometry. * Citation of this dataset Quesnel, Y., Sailhac, P., Lofi, J., Lambert, P., Rochette, P., Uehara, M. & Camerlynck, C. (2021). RochElec : Geoelectrical investigations on the Rochechouart impact structure (France) [Data set]. CEREGE UMR 7330 CNRS. https://doi.org/10.34930/BE0549D1-E876-49C5-B07F-BF04D398B25E * Publications linked with the dataset: Quesnel, Y., Sailhac, P., Lofi, J., Lambert, P., Rochette, P., Uehara, M. & Camerlynck, C. (2021). Rochechouart impact structure, France. Geochemistry, Geophysics, Geosystems, 22, e2021GC010036, https://doi.org/10.1029/2021GC010036
-
Acquisition automatique sur le long terme et en temps réel de données de niveau d'eau et de température le long du littoral Varois (France) Le programme consiste à apporter des données de mesures originales pour une meilleure compréhension et modélisation des interactions et couplages entre la dynamique côtière et la dynamique littorale à l'échelle des baies (actuellement aire de l'agglomération toulonnaise avec projet d'extension à plus grande échelle le long de la côte méditerranéenne), par le développement d'un système d'observation sur le long terme (plusieurs années). Il est à l'interface des axes de recherche en dynamique du plateau continental et en dynamique littorale du laboratoire MIO, composante de l'Observatoire des Sciences de l'Univers PYTHEAS.