 OSU Pytheas - Data Catalog
notPlanned
Type of resources
Available actions
Topics
INSPIRE themes
Keywords
Contact for the resource
Provided by
Formats
Representation types
Update frequencies
status
Scale
-
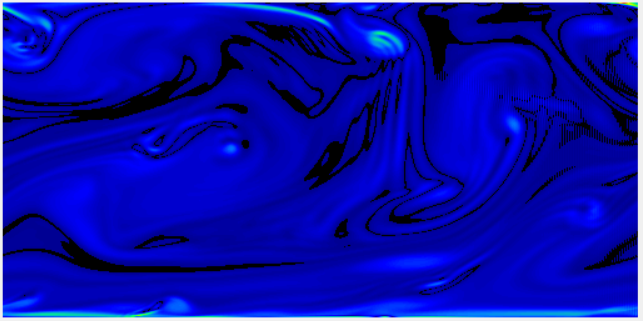
Wind is generated from left to right by an imposed constant horizontal pressure gradient. The initial wind field is disturbed by small random variations so as to produce a turbulent field. Withouth the perturbations, a viscous solution would be found. The numerical resolution technique used is based on finite differences, applied to a structured mesh. The Continuity and Navier-Stokes equations are solved with the well-known half time-step method, in which the Poisson equation is solved over the entire domain at each time iteration. As of 17 March 2022, the code version is DNS_2D_for_Teaching-v1.0.0. The code is written in C language. A GUI (Graphical User Interface) is available as an executable file "sdiapp.exe" that can be run under most versions of Microsoft Windows. Please just make sure to check the 'graph' box before clicking on the launch button, to have the visual experience. On the GUI, two graphs give an overview of the real time simulation. The top graph shows the 2D (x,z) vorticity, while the bottom graph shows the wind speed. The colour bars are not shown, but they are classical tables in which blue means small values, while red colours denote large values. The authors of this code version are Francis Vivat (LATMOS UMR CNRS 8190) and Denis Bourras (MIO UMR 7294). The code is distributed freely and comes with no garantees. It was mainly designed for educational purposes. Please note that the rules of use must follow the CeCILL-C FREE SOFTWARE LICENSE AGREEMENT included in the distribution. Any return is welcomed and encouraged, please contact francis.vivat@latmos.ipsl.fr or denis.bourras@mio.osupytheas.fr. Citation: Vivat, F., & Bourras, D., (2023). DNS_2D_for_Education [Application].
-
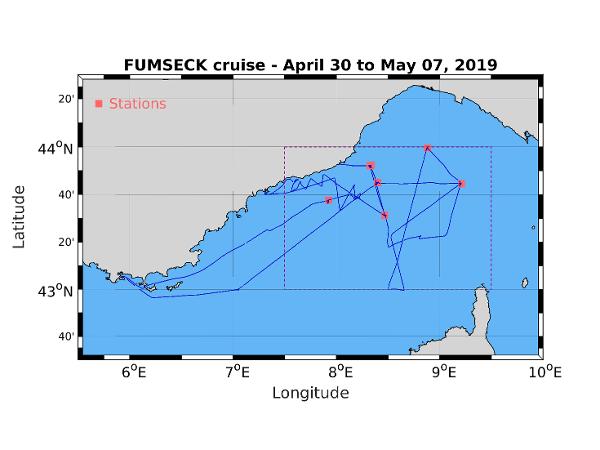
The FUMSECK (Facilities for Updating the Mediterranean Submesoscale - Ecosystem Coupling Knowledge) cruise aimed at performing technological tests of several instruments exploited for the study of the (sub)meso-scale processes and dynamics (from 0.1 to 100 km for a lifetime from several days to several weeks). Three categories of tests have been performed. The first category is the study of the MVP (Moving Vessel Profiler) tracked instruments behaviour, in particular the MSFFFII (Multi Sensor Free Fall Fish, so called "big fish"). We focused on the rotative behaviour of the big fish during its falling and raising, the connectics between the instrument and the MVP cable, between the platform and the boat depth sensor, and between the platform and the PC used to analyse the data, hence testing the whole data acquisition chain. The second category concerns the exploration of several methods to access the measurement of the current velocities vertical component, using different ADCP (Hull-mounted ADCP, Fixed-depth and profiling L-ADCP and Sentinel V (5 beams), Free-Fall ADCP), a prototype of a vertical velocity profiler, and a glider. Finally, we experimented the release of a sample of biodegradable coloured micro-particles at 15m-depth and within a 1 hectare surface, their tracking with drifting buoys, their extraction by pumping and their detection by cytometry. The goal of this experiment was its feasibility, in order to use these micro-particules as tracers for the understanding of the physical part of the ocean biological Carbon pump. Data acquired during the campain are : - Biological oceanography : * B08 Phytoplankton 7 days Continuous sampling for cytometer analysis. 15m-depth sampling for cytometer analysis (3 samples). 30.04.2019 * B90 Other biological/fisheries meas. 1 days GoPro images for the injection, the following and the sampling of coloured micro-particles. 30.04.2019 - Physical oceanography : * D05 Surface drifters/drifting buoys 3 deployments Injection, following, and sampling of coloured micro-particles at 15m-depth. Deployment and recovery of lagrangian drifters anchored at 15m for water mass following. 30.04.2019 * D71 Current profiler (eg ADCP) 7 days Continuous Vessel-Mounted ADCP. L-ADCP and Sentinel casts (5 and 6 stations). Free-Fall ADCP (6 stations). 30.04.2019 * D90 Other physical oceanographic meas. 7 days MVP (Moving Vessel Profiler) 30.04.2019 * D90 Other physical oceanographic meas. 6 stations VVP (Vertical Velocity Profiler) 30.04.2019 * H10 CTD stations 6 stations CTD casts 30.04.2019 * H71 Surface measurements underway (T,S) 7 days Continuous measurement 30.04.2019
-

This Application is a simple calculator that estimates Turbulent Air-Sea Fluxes based on input variables such as wind speed, air temperature, or relative humidity. The input variables can be easily set by hand with sliders. The present Air-Sea Flux Calculator application makes it easy to get an estimate of the fluxes at Sea of for Educational purposes The code is a simplification of the well known bulk algorithm so-called COARE 3.0 (Fairall et al. 2003). The authors of this code are Nicolas Bourras and Denis Bourras (MIO CNRS UMR 7294, Institut Méditerranéen d'Océanologie, Institut Pytheas CNRS UAR 3470, Aix-Marseille University). Citation: Bourras, N., & Bourras, D., (2023). Air-Sea flux calculator [Application].
-
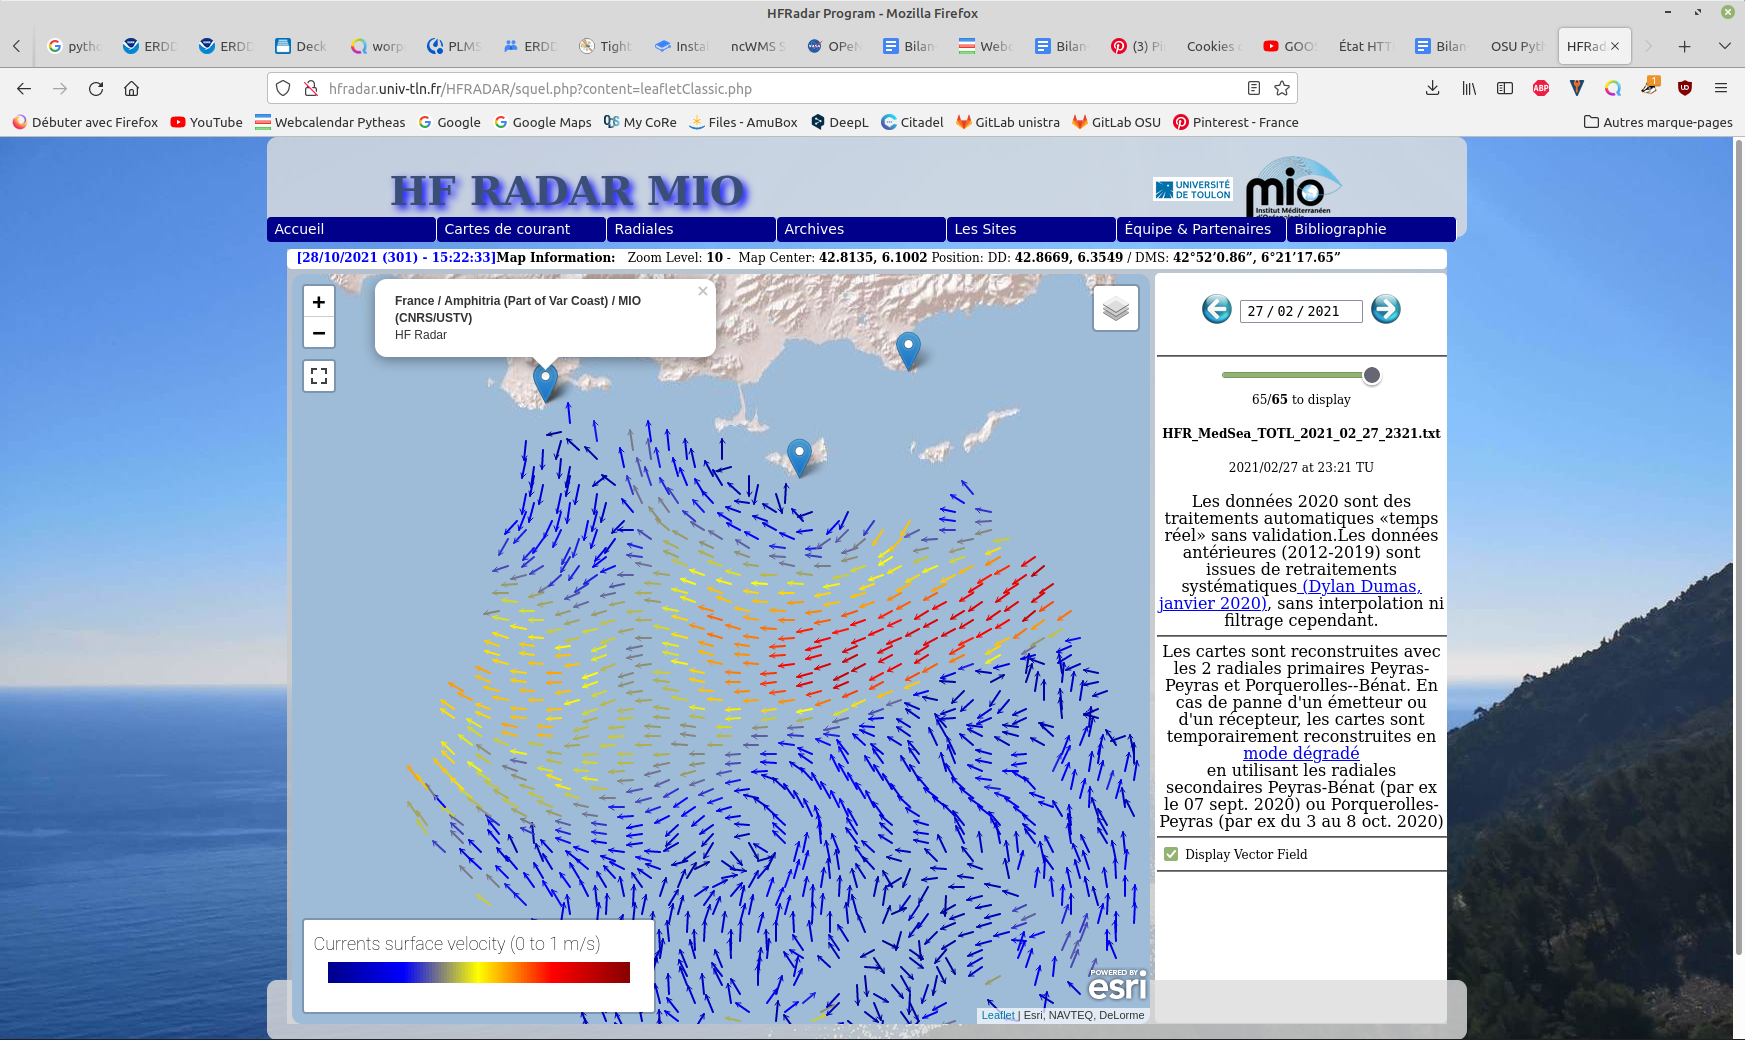
Hourly High Frequency Radar (HFR) surface current data (ocean surface velocity) from 2 different stations located on the French Mediterranean coast (Toulon), processed in real time. The total velocity is then reconstructed from the filled radial velocity files, and projected onto a cartesian grid of 1km x 1km. The HFR data comes from two systems, one monostatic radar PEY (located at Fort Peyras, La Seyne sur mer), and one bistatic POB (receiver located at Cap Bénat - Bormes les Mimosas, and transmitter on Porquerolles Island). The HFR data is initially hourly sampled. The radial velocity are processed by an algorithm of Directional of Arrival Finding with a self-calibration method developed by our laboratory. HF radar sites : - Peyras : 43°03'47.4"N, 5°51'40.3"E - Porquerolles (transmitter only): 42°58'59.0"N, 6°12'15.3"E - Bénat (receiver only): 43°05'31.5"N, 6°21'26.5"E EUROPEAN DIRECTORY OF MARINE ENVIRONMENTAL RESEARCH PROJECTS (EDMERP) : - SICOMAR PLUS(12402), IMPACT(12271), MOOSE(11574), and JERICO NEXT(12227) EQUIPEMENTS: - High Frequency Surface Wave radar WERA from HELZEL MESSTECHNIK PARAMETERS: - sea surface current Citation: - Dylan Dumas, Charles-Antoine Guerin, Self-calibration and antenna grouping for bistatic oceanographic High-Frequency Radars,2020, https://arxiv.org/abs/2005.10528
-
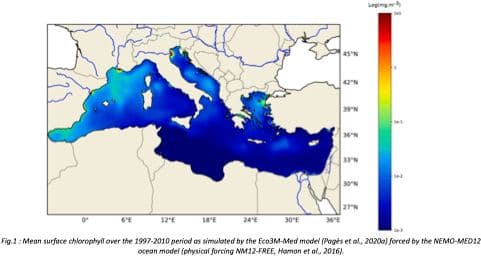
"Towards an integrated prediction of Land & Sea Responses to global change in the Mediterranean Basin" The LaSeR-Med project aims at investigating the effects of climate change and of mediterranean population growth on some major indicators of the Mediterranean Sea (primary production, carbon export, zooplankton biomass available for small pelagic fishes, pH, dissolved oxygen) using and integrated model encompassing a socio-economic model, a continental model of agro-ecosystems, and a physical ocean-atmosphere model coupled to a biogeochemical model of the ocean. Last, a model for the widespread species of jellyfish Pelagia Noctiluca (Berline et al., 2013) uses biogeochemical outputs as food forcing for the jellyfish. In this project, our first aim was to investigate the large-scale and long-term impacts of variations in river inputs on the biogeochemistry of the Mediterranean Sea over the last decades (see Pages et al., 2020a). This interdisciplinary project provided the framework for joint discussions on each of the sub-models that constitute the integrated model, namely the socio-economic model (Ami et al., in prep., Mardesic et al., in prep.) created ex nihilo by researchers from AMSE, INRA and GREQAM, the continental agro-ecosystem model LPJmL (Bondeau et al., 2007) worked on at IMBE so as to include the nitrogen and phosphorous cycles in the frame of the present project, and the ocean biogeochemical model Eco3M-Med developed at MIO (Baklouti et al., 2006; Alekseenko et al. 2014, Guyennon et al., 2015; Pagès et al., 2020a), forced by ocean physics, either using the ocean model NEMO-Med12 forced by atmosphere at IPSL (simulation NM12-FREE run with the NEMO-MED12 model and used for our hindcast simulation, see below) or a coupled ocean-atmosphere model at CNRM (physical forcing provided by CNRM-RCSM4, see below). Details on simulation NM12-free: The historical simulation used in this work is referred to as the NM12-FREE (no reanalysis no data assimilation) which started in October 1979 and ended in June 2013 (Hamon et al., 2016). It has been run with the general circulation model NEMO in its regional configuration NEMO-MED12 based on a horizontal resolution of 1/12 de degree (6.5 to 8 km cells) and a 75-level vertical resolution (of 1 m width at the surface to 135 m at the seabed). For this simulation, runoff and river inputs in the NM12 domain came from the inter-annual data of Ludwig et al. (2009) and the atmospheric forcing was based on the dynamical downscaling of the ERA-INTERIM reanalysis, i.e. ALDERA which has a 12 km spatial resolution and a 3 h temporal resolution. More details on the NM12-FREE simulation are given in Hamon et al. (2016). Keywords: - Mediterranean Sea, river inputs, chlorophyll, nutrients, phytoplankton, bacteria, zooplankton, dissolved and particulate organic detrital matter Citation: Pagès, R., Baklouti, M., Barrier, N., Richon, C., Dutay, J.-C., and Moutin, T. (2020a). Changes in rivers inputs during the last decades significantly impacted the biogeochemistry of the eastern Mediterranean basin: a modelling study. Prog. Oceanogr. 181:102242. doi:10.1016/j.pocean.2019.102242 Ayache, M., Bondeau, A., Pagès, R., Barrier, N., Ostberg, S. and Baklouti, M. (2020). LPJmL-Med – Modelling the dynamics of the land-sea nutrient transfer over the Mediterranean region–version 1: Model description and evaluation. Geoscientific Model Development Discussions, Copernicus Publ.
-
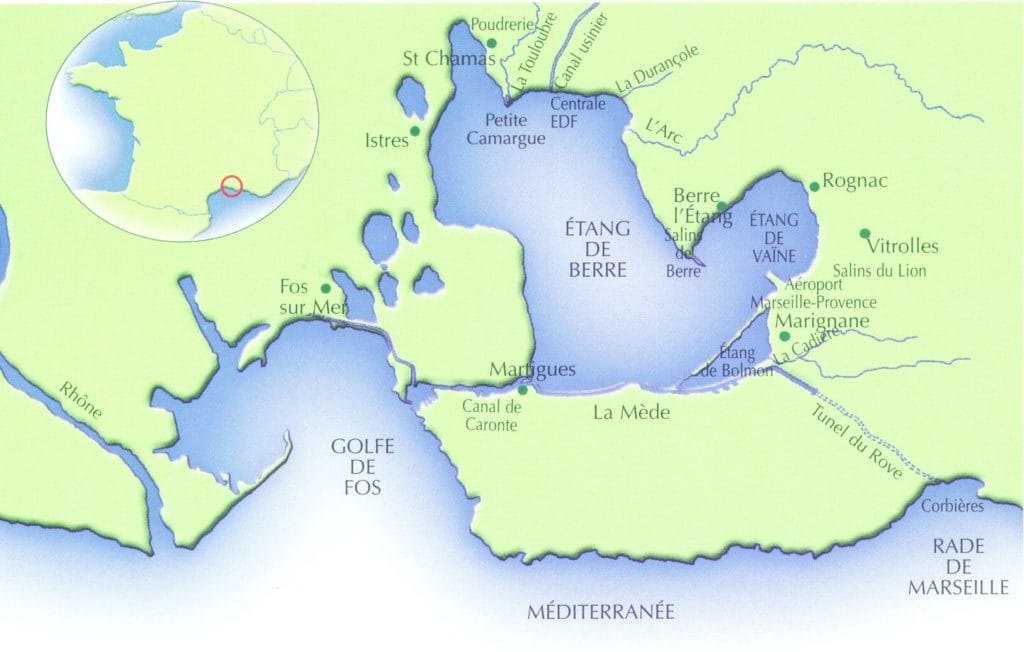
L’Observatoire du milieu porté par le GIPREB (Groupement d’Intérêt Publique pour la Réhabilitation de l’Etang de Berre) a pour vocation de suivre depuis 1994 l’évolution hydrologique et biologique de l’étang de Berre (France, Méditerranée). Le suivi mis en place au sein de l’Observatoire du GIPREB répond pour l’étang de Berre aux quatre grandes problématiques que sont : - le contrôle des apports par les bassins versants, - le contrôle de l’eutrophisation, - la contamination et - le niveau de réponse des biocénoses et habitats. L’étang de Berre, d’une superficie de 155 km2 et une lagune saumâtre (qualifiée d’« eaux de transitions » au titre de la directive-cadre sur l’eau) située dans les bouches du Rhône (France) . Sa profondeur moyenne est de 6,5 mètres, pouvant atteindre 9 mètres au centre de l’étang. Elle est reliée à la mer méditerranée par le chenal de Caronte au sud et reçoit l’eau des trois rivières que sont la Touloubre, l’Arc et la Durançole. Au sud l’étang de Bolmon (en communication avec l’étang de Berre) reçoit lui les eaux de la Cadière. Ses apports du bassin versant naturel sont complétés par ceux de la chaîne hydro-électrique Durance-Verdon dont les eaux douces sont rejetées sur les rivages nord de l’étang. (CF carte). La population du bassin versant naturel (1 700 km²) de l’étang de Berre s’élève à 600 000 habitants. Les vents sont caractérisés par deux secteurs dominants : N-NW (le mistral est le vent dominant et fréquent) et S-E. L’étang de Berre constitue un milieu eutrophe avec de fréquentes efflorescences algales et des phénomènes récurrents d’appauvrissement ou de disparition de l’oxygène de ses eaux. - informations sur l'étang de Berre : https://etangdeberre.org/comprendre/generalites-sur-letang-de-berre/ Bases de données mises à disposition : ============================== - Hydrologie : • Haute Fréquence en une station (H12) depuis 2020 : S, O2, Température à trois profondeurs (surface – milieu – fond) • Prélèvement mensuel en 10 stations en surface et fond depuis 1994 : O2, NH4, NO2, NO3, PO4, SiOH4, Nt/Pt, COP/NOP, MES, Chla/Pheo • Profil de sonde mensuel en 10 stations depuis 1994 : S, O2, T°C - Espèces benthiques depuis 2002 : Prélèvement mensuel en 8 stations - Phytoplancton : Prélèvement mensuel en 2 stations - Macrophytes depuis 2001 : Comptage annuel des macrophytes sur 31 transects - Herbier de Zostère depuis 2004 : Cartographie annuelle de tous les herbiers dans l’étang (format .shp)
-
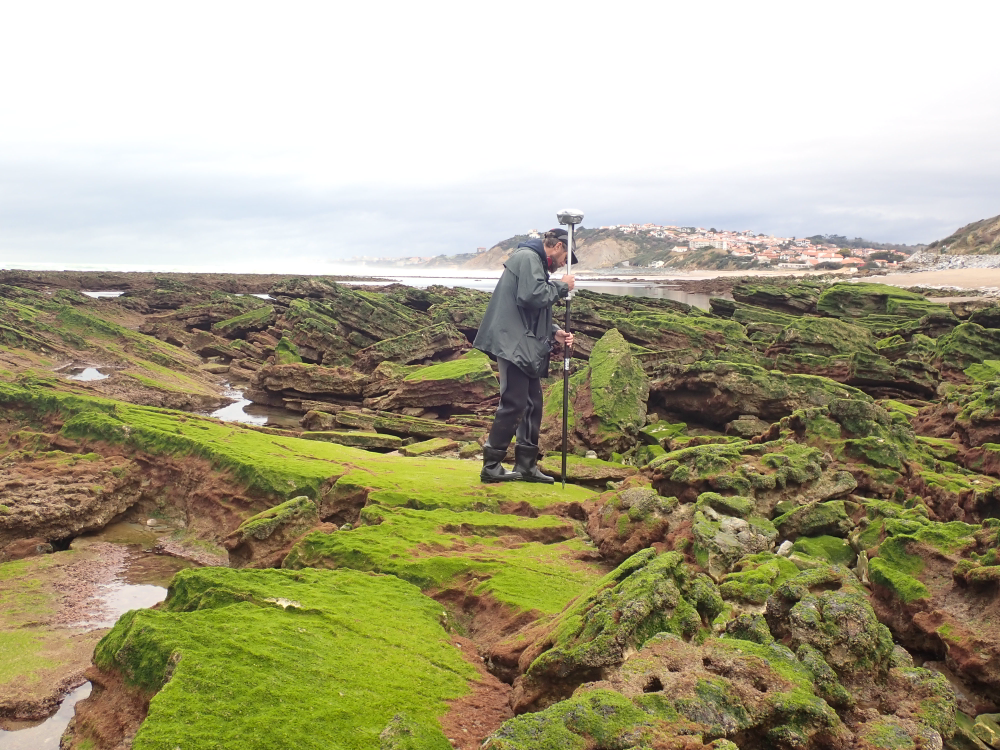
The present dataset is based on a nine site study of fine seabed topography in intertidal zones. Four coral sites (Maupiti A, B and C and Niau islands) and five rocky sites (Ars en Ré, Socoa, Parlementia A and B and Banneg island) have been explored. The data has been gathered using on-foot GNSS RTK for all sites (Trimble R8/R8S and Leica sytems) except Banneg island, where aerial Lidar data from Litto3D program has been used. The horizontal resolution varies between 3.8 and 12cm allowing to describe a wide range of spatial scales (generally over 3 spectral decades). The data has been processed to explore the statistical and spectral metrics which can be used to characterize the architectural complexity of seabeds. Owners: - Topographic survey on Ars-en-Ré : profile X, Z in meter along a transec was operated on 10-15 Jan 2021 with On-foot Trimble R8/R8S GNSS RTK by Shom, Gladys and Univ. de Montpellier - Topographic survey on Maupiti Hoe: profile X, Z in meter along a transec was operated on 5-10 July 2018 with on-foot Trimble R8/R8S GNSS RTK by GLADYS and Université de Montpellier - Topographic survey on Niau : profile X, Z in meter along a transec operated on 10 Nov. 2021 with On-foot Trimble R8/R8S GNSS RTK - by CEREGE and MIO (OSU Pytheas) - Topographic survey on Parlementia A, and B : profile X, Z in meter along a transec was operated on 22 Fev 2023 with on-foot Leica GNSS RTK by SIAME, UPPA - Topographic survey on Socoa : profile X, Z in meter along a transec was operated on 21 Fev 2023 with on-foot Leica GNSS RTK by SIAME, UPPA and Shom - Topographic survey in high resolution of Banneg island (X, Y, Z) is made by aerial lidar litto3D on spring 2012/2013 by Shom and IGN
-

Hourly High Frequency Radar (HFR) surface current data (ocean surface velocity) from 2 different stations located on the French Mediterranean coast (Toulon), reprocessed. The total velocity is then reconstructed from the filled radial velocity files, and projected onto a cartesian grid of 1km x 1km. The HFR data comes from two systems, one monostatic radar PEY (located at Fort Peyras, La Seyne sur mer), and one bistatic POB (receiver located at Cap Bénat - Bormes les Mimosas, and transmitter on Porquerolles Island). The HFR data is initially hourly sampled. The radial velocity are processed by an algorithm of Directional of Arrival Finding with a self-calibration method developed by our laboratory. Total velocities are derived using least square fit that maps radial velocities measured from individual sites onto a cartesian grid. The final product is a map of the horizontal components of the ocean currents on a regular grid in the area of overlap of two or more radar stations. Each radar station produces radial velocities map using an hybrid method mixing Beam Forming and Direction Finding according the algorithms described in - New Signal Processing Techniques for Phased-Array Oceanographic Radars: Self-Calibration, Antenna Grouping, and Denoising - https://doi.org/10.1175/JTECH-D-22-0064.1 HF radar sites : - Peyras : 43°03'47.4"N, 5°51'40.3"E - Porquerolles (transmitter only): 42°58'59.0"N, 6°12'15.3"E - Bénat (receiver only): 43°05'31.5"N, 6°21'26.5"E EUROPEAN DIRECTORY OF MARINE ENVIRONMENTAL RESEARCH PROJECTS (EDMERP) : - SICOMAR PLUS(12402), IMPACT(12271), MOOSE(11574), and JERICO NEXT(12227) EQUIPEMENTS: - High Frequency Surface Wave radar WERA from HELZEL MESSTECHNIK PARAMETERS: - sea surface current Citation: - Dylan Dumas, Charles-Antoine Guerin, Self-calibration and antenna grouping for bistatic oceanographic High-Frequency Radars, 2020, https://arxiv.org/abs/2005.10528 - Dylan Dumas, Charles-Antoine Guerin, New Signal Processing Techniques for Phased-Array Oceanographic Radars: Self-Calibration, Antenna Grouping, and Denoising, 2023, https://doi.org/10.1175/JTECH-D-22-0064.1
-
L’Observatoire du milieu porté par le GIPREB (Groupement d’Intérêt Publique pour la Réhabilitation de l’Etang de Berre) a pour vocation de suivre depuis 1994 l’évolution hydrologique et biologique de l’étang de Berre (France, Méditerranée). Prélèvement mensuellement en 10 stations de l’étang de Berre au fond et en surface. ================================================================= * Paramètres : Sels nutritifs (NO3, NO2, PO4) ; Ammonium (NH4) ; Ptot/Ntot ; COP/NOP (carbone et azote particulaire); Pigments (Chla/Phéo) ; MES (matières en suspension) * Date de début de la série : juin 1994 * Prélèvement : Bouteille Niskin. Opérateur : GIPREB *Analyse Opérateur : Mediterranean Institute of Oceanography (MIO UMR 7294 CNRS) - Méthode NO3, NO2, PO4 : Colorimétrie (Analyseur automatique) - Méthode NH4+ : Dosage par Fluorimétrie - Méthode Chla/Phéo : Filtration et Fluorimétrie - Méthode COP/NOP (carbone et azote organique particulaire) : Filtration et Analyseur élémentaire - Méthode MES (matiere en suspension) : Filtration et Pesée Autres données HF disponibles au point H12 : Oxygène, Salinité, Température au milieu-fond-surface depuis 2020
-
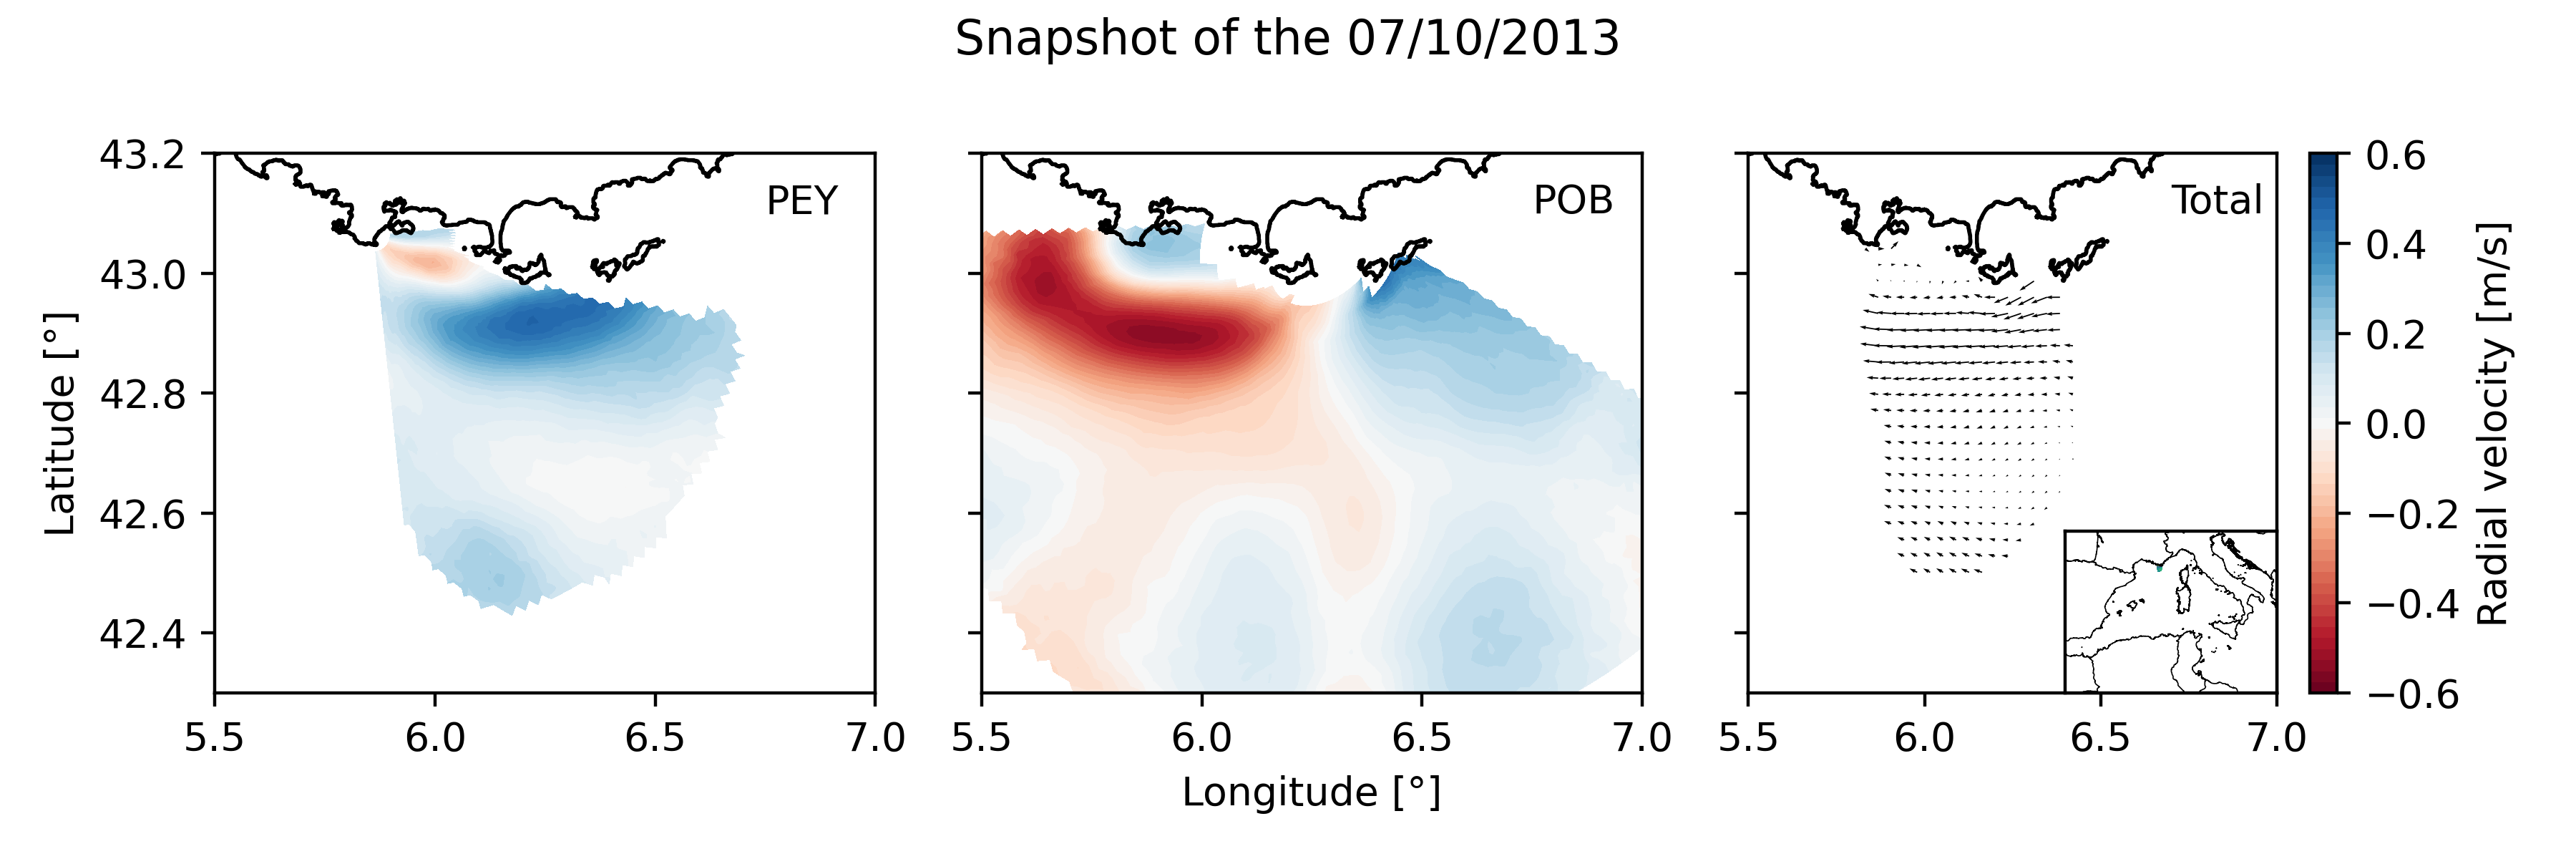
Daily High Frequency Radar (HFR) surface current data (radial velocity files and total velocity file) from 2 different stations located on the French Mediterranean coast (Toulon), spanning from January 2012 to December 2019. The radial datasets have been processed to remove outliers. Then, the gaps in the data have been filled using the DINEOF algorithm. The total velocity is then reconstructed from the filled radial velocity files, and projected onto a cartesian grid of 1km x 1km. The HFR data comes from two systems, one monostatic radar PEY (located at Fort Peyras, La Seyne sur mer), and one bistatic POB (emitter located at Cap Bénat - Bormes les Mimosas, and transmitter on Porquerolles Island). The HFR data is initially hourly sampled. To remove the outliers of the data, for each timestep, a Probability Density Function (PDF) is computed on the spatial gradient of each radial map. Pixels with a spatial gradient with a probability under 3% are removed. Additionnally, for each pixel, a PDF is computed on the temporal gradient of its whole timeseries. Timesteps with a temporal gradient that have a probability under 1% are then removed. Then we proceed to a preliminary temporal and spatial hole filling of the missing data. For the timeseries of each pixel, timesteps that are surrounded by valid values within 3 hours (i.e. 3 timesteps) are filled by a weighted linear interpolation. For each timestep, pixels of the map surrounded by values within 1 grid point are filled in the same way. The radial data is then daily averaged. The DINEOF algorithm (https://orbi.uliege.be/bitstream/2268/87104/1/IMDIS_alvera30sep.pdf) is run in a multivariate way (2 radial velocity files) using 50 EOF modes for the reconstruction. At some timesteps (shown by the flag variable of the file), the filling has not been possible, and the missing maps have been replaced by the temporal average radial map. The filled radial velocities are then locally interpolated onto a cartesian grid of 1km spatial resolution using a Weighted Least Square method. HF radar sites : - Peyras : 43°03'47.4"N, 5°51'40.3"E - Porquerolles (transmitter only): 42°58'59.0"N, 6°12'15.3"E - Bénat (receiver only): 43°05'31.5"N, 6°21'26.5"E EUROPEAN DIRECTORY OF MARINE ENVIRONMENTAL RESEARCH PROJECTS (EDMERP) : - SICOMAR PLUS(12402), IMPACT(12271), MOOSE(11574), and JERICO NEXT(12227) EQUIPEMENTS: - High Frequency Surface Wave radar WERA from HELZEL MESSTECHNIK PARAMETERS: - sea surface current Citation: Molcard, A., & Bourg, N. (2021). HF RADAR - French Riviera (Mediterranean Institute of Oceanography) - daily surface currents filled with DINEOF [Data set]. MIO UMR 7294 CNRS. https://doi.org/10.34930/9263C4DF-4F55-4C5A-B183-C40EE1D844B1