R-shiny-microorganisms : A ready-to-use logistic regression implemented in R shiny to estimate growth parameters of microorganisms
Environmental conditions are a set of physical and biological variables that define an ecosystem. Microorganisms with higher generation times than more complex multicellular organisms are more sensitive to changing environmental conditions.
Therefore, microbial growth curves are an important and simple way to understand how environmental conditions affect microorganisms. Growth curves are used in a variety of biological applications. Traditionally in microbiology, the maximum growth rate (µmax) is calculated by fitting a linear model on data of the exponential growth phase.
This method is simple to implement, and robust if the exponential phase contains many points. However, this method is very limiting when the curve is described with few points, as we have seen with experiments under high pressure conditions. In order to overcome this limit, recurrent in biology, we propose to use models to estimate growths parameters.
Modeling has existed for many years to describe the growth behavior of microorganisms under variable physical and chemical conditions (Zwietering et al., 1990). Here we propose a ready-to-use application that do not require any special coding skills and allow retrieving several essential parameters describing microbial growth.
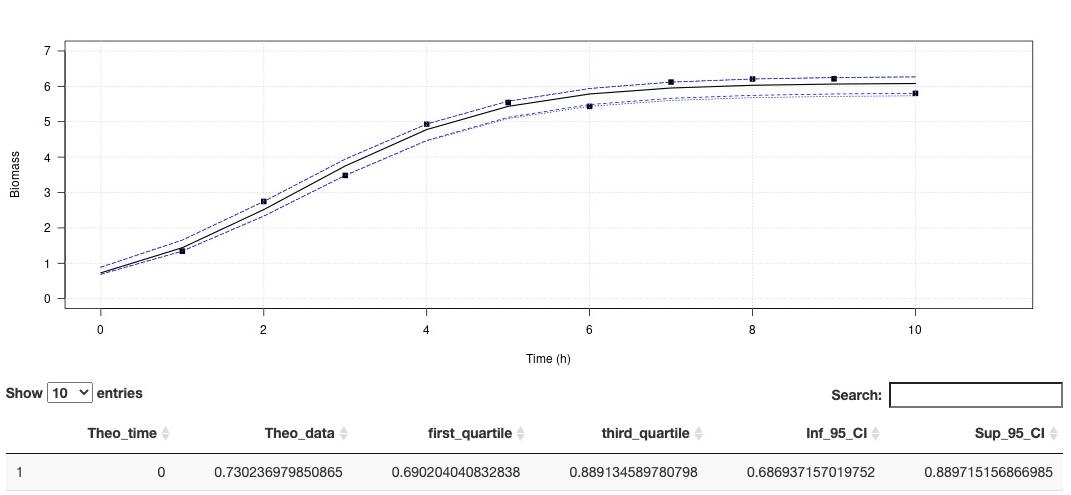
his app aims at estimating the growth rate and maximum cells density using non-linear regression. The method is detailled in Martini et al. (2013).
A demo dataset is available in "Download a demo dataset", you can save it in your computer and load it using "Browse", or you can also browse your own dataset.
On Plot panel, it is possible to set axes labels, axes range and Smooth. Smooth parameter can compute theorical (downloadable) for to use with other activities.
In order to run this application, you have to format your dataset with tabulation separators. Also, remove all spaces in the dataset header (prefer to use "_" when needed). Organise your dataset so that there is only two arrays. The first one being the time and the second one, the cells density (e. g. optic density, cell number, biomass). This application proposes a method to perform a logistic regression to estimate growth rate as well as maximum cells density .
Citation:
Garel, M., Izard, L., Vienne, M., Nerini, D., Tamburini, C., Martini, S. (2021). R-shiny-microorganisms v2 : A ready-to-use logistic regression implemented in R shiny to estimate growth parameters of microorganisms [Data set]. MIO UMR 7294 CNRS. https://doi.org/10.34930/DC1DAF1C-09E3-4829-8878-91D0BF0E643E
Simple
- Date (Publication)
- 2021-06-03T08:00:00
- Purpose
-
A ready-to-use logistic regression implemented in R shiny to estimate growth parameters of microorganisms
- Status
- On going
- Maintenance and update frequency
- Irregular
-
GEMET - Concepts, version 2.4
-
-
software
-
software development
-
-
Continents, countries, sea regions of the world.
-
-
France
-
- Theme
-
-
Microbiology
-
modelling
-
logistic regression
-
growth curve
-
- Access constraints
- Copyright
- Use constraints
- otherRestictions
- Other constraints
-
Creative Common CC-BY
- Spatial representation type
- Vector
- Denominator
- 5000
- Language
- English
- Character set
- UTF8
- Begin date
- 2021-02-01
- End date
- 2021-02-25
- Description
-
marseille luminy
))
- Supplemental Information
-
Marseille Luminy
- Reference system identifier
- WGS 1984
- Distribution format
-
-
R software
(
1.0
)
-
R software
(
1.0
)
- OnLine resource
- estimating the growth rate and maximum cells density using non-linear regression ( WWW:LINK-1.0-http--link )
- OnLine resource
- R code access ( WWW:LINK-1.0-http--link )
- OnLine resource
- DOI ( DOI )
- Hierarchy level
- Service
- Statement
-
This app aims at estimating the growth rate and maximum cells density using non-linear regression. The method is detailled in Martini et al. (2013).
A demo dataset is available in "Download a demo dataset", you can save it in your computer and load it using "Browse", or you can also browse your own dataset.
On Plot panel, it is possible to set axes labels, axes range and Smooth. Smooth parameter can compute theorical (downloadable) for to use with other activities.
In order to run this application, you have to format your dataset with tabulation separators. Also, remove all spaces in the dataset header (prefer to use "_" when needed). Organise your dataset so that there is only two arrays. The first one being the time and the second one, the cells density (e. g. optic density, cell number, biomass). This application proposes a method to perform a logistic regression to estimate growth rate as well as maximum cells density . The logistic equation is defined as
x(t)=r.x0.(1−x0K)
Citation:
Garel, M., Izard, L., Vienne, M., Nerini, D., Tamburini, C., Martini, S. (2021). R-shiny-microorganisms v2 : A ready-to-use logistic regression implemented in R shiny to estimate growth parameters of microorganisms [Data set]. MIO UMR 7294 CNRS. https://doi.org/10.34930/DC1DAF1C-09E3-4829-8878-91D0BF0E643E
- File identifier
- dc1daf1c-09e3-4829-8878-91d0bf0e643e XML
- Metadata language
- English
- Character set
- UTF8
- Hierarchy level
- Service
- Hierarchy level name
-
dataset
- Date stamp
- 2021-07-16T16:49:02
- Metadata standard name
-
ISO 19115:2003/19139
- Metadata standard version
-
1.0
Overviews


Spatial extent
))
Provided by

 OSU Pytheas - Data Catalog