 OSU Pytheas - Data Catalog
service
Type of resources
Keywords
Contact for the resource
Provided by
Formats
Representation types
Update frequencies
status
Scale
-
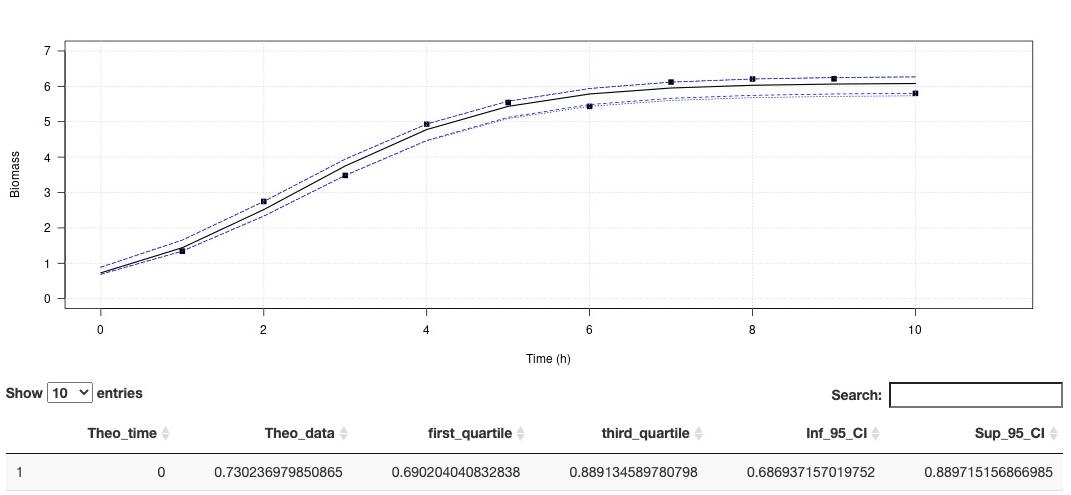
Environmental conditions are a set of physical and biological variables that define an ecosystem. Microorganisms with higher generation times than more complex multicellular organisms are more sensitive to changing environmental conditions. Therefore, microbial growth curves are an important and simple way to understand how environmental conditions affect microorganisms. Growth curves are used in a variety of biological applications. Traditionally in microbiology, the maximum growth rate (µmax) is calculated by fitting a linear model on data of the exponential growth phase. This method is simple to implement, and robust if the exponential phase contains many points. However, this method is very limiting when the curve is described with few points, as we have seen with experiments under high pressure conditions. In order to overcome this limit, recurrent in biology, we propose to use models to estimate growths parameters. Modeling has existed for many years to describe the growth behavior of microorganisms under variable physical and chemical conditions (Zwietering et al., 1990). Here we propose a ready-to-use application that do not require any special coding skills and allow retrieving several essential parameters describing microbial growth. his app aims at estimating the growth rate and maximum cells density using non-linear regression. The method is detailled in Martini et al. (2013). A demo dataset is available in "Download a demo dataset", you can save it in your computer and load it using "Browse", or you can also browse your own dataset. On Plot panel, it is possible to set axes labels, axes range and Smooth. Smooth parameter can compute theorical (downloadable) for to use with other activities. In order to run this application, you have to format your dataset with tabulation separators. Also, remove all spaces in the dataset header (prefer to use "_" when needed). Organise your dataset so that there is only two arrays. The first one being the time and the second one, the cells density (e. g. optic density, cell number, biomass). This application proposes a method to perform a logistic regression to estimate growth rate as well as maximum cells density . Citation: Garel, M., Izard, L., Vienne, M., Nerini, D., Tamburini, C., Martini, S. (2021). R-shiny-microorganisms v2 : A ready-to-use logistic regression implemented in R shiny to estimate growth parameters of microorganisms [Data set]. MIO UMR 7294 CNRS. https://doi.org/10.34930/DC1DAF1C-09E3-4829-8878-91D0BF0E643E
-

Labellisation CNRS/INSU : CNAP-AA-ANO5 OSU Pythéas : responsable du service Contact : O. Ilbert olivier.ilbert@lam.fr, Laboratoire d'Astrophysique de Marseille (LAM) Le service GAlaxy photometric redshifts (Z) and physical PARameters (GAZPAR) propose de produire les redshifts photométriques et les paramètres physiques de galaxies à partir de catalogues photométriques multi-longueurs d’onde fournis par l’utilisateur. Ce service repose actuellement sur plusieurs logiciels publics, "Cigale", "Le Phare" et "Beagle". "Hyperz" est en cours d’intégration au service. Ces codes utilisent des techniques d’ajustement de Distribution d’Energie Spectrale (SED) exploitant les données disponibles de l’ultraviolet à l’infrarouge lointain et en modélisant la SED des différents composants d’une galaxie (étoiles, gaz, noyau actif, poussières). Pour chaque objet d’un catalogue le service propose la détermination du redshift photométrique, une classification par type étoile/galaxie/QSO ainsi que les principales caractéristiques physiques des galaxies (masse stellaire, taux de formation d’étoiles, atténuation, luminosité infrarouge, etc...) Les distributions de probabilité associées sont également fournies, ainsi que les fichiers de configuration utilisés et les résultats de nombreux tests de qualité. Une interface web permet aux utilisateurs de déposer leurs catalogues via le centre de données du Laboratoire d'Astrophysique de Marseille (CeSAM), et un soutien personnalisé est offert aux utilisateurs qui souhaitent faire leurs propres mesures. Le service prévoit de se développer en ajoutant la possibilité d’inclure et de traiter des informations spectroscopiques.