software
Type of resources
Keywords
Contact for the resource
Provided by
Formats
Representation types
Update frequencies
status
Scale
-

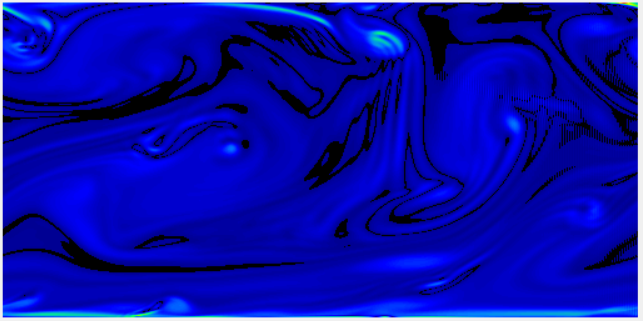
Wind is generated from left to right by an imposed constant horizontal pressure gradient. The initial wind field is disturbed by small random variations so as to produce a turbulent field. Withouth the perturbations, a viscous solution would be found. The numerical resolution technique used is based on finite differences, applied to a structured mesh. The Continuity and Navier-Stokes equations are solved with the well-known half time-step method, in which the Poisson equation is solved over the entire domain at each time iteration. As of 17 March 2022, the code version is DNS_2D_for_Teaching-v1.0.0. The code is written in C language. A GUI (Graphical User Interface) is available as an executable file "sdiapp.exe" that can be run under most versions of Microsoft Windows. Please just make sure to check the 'graph' box before clicking on the launch button, to have the visual experience. On the GUI, two graphs give an overview of the real time simulation. The top graph shows the 2D (x,z) vorticity, while the bottom graph shows the wind speed. The colour bars are not shown, but they are classical tables in which blue means small values, while red colours denote large values. The authors of this code version are Francis Vivat (LATMOS UMR CNRS 8190) and Denis Bourras (MIO UMR 7294). The code is distributed freely and comes with no garantees. It was mainly designed for educational purposes. Please note that the rules of use must follow the CeCILL-C FREE SOFTWARE LICENSE AGREEMENT included in the distribution. Any return is welcomed and encouraged, please contact francis.vivat@latmos.ipsl.fr or denis.bourras@mio.osupytheas.fr. Citation: Vivat, F., & Bourras, D., (2023). DNS_2D_for_Education [Application].
-

This Application is a simple calculator that estimates Turbulent Air-Sea Fluxes based on input variables such as wind speed, air temperature, or relative humidity. The input variables can be easily set by hand with sliders. The present Air-Sea Flux Calculator application makes it easy to get an estimate of the fluxes at Sea of for Educational purposes The code is a simplification of the well known bulk algorithm so-called COARE 3.0 (Fairall et al. 2003). The authors of this code are Nicolas Bourras and Denis Bourras (MIO CNRS UMR 7294, Institut Méditerranéen d'Océanologie, Institut Pytheas CNRS UAR 3470, Aix-Marseille University). Citation: Bourras, N., & Bourras, D., (2023). Air-Sea flux calculator [Application].
-

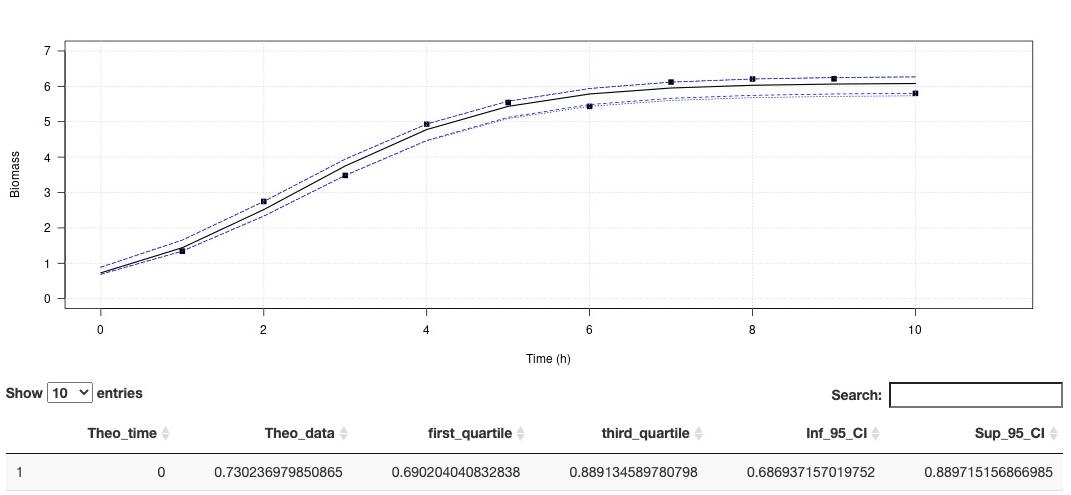
Environmental conditions are a set of physical and biological variables that define an ecosystem. Microorganisms with higher generation times than more complex multicellular organisms are more sensitive to changing environmental conditions. Therefore, microbial growth curves are an important and simple way to understand how environmental conditions affect microorganisms. Growth curves are used in a variety of biological applications. Traditionally in microbiology, the maximum growth rate (µmax) is calculated by fitting a linear model on data of the exponential growth phase. This method is simple to implement, and robust if the exponential phase contains many points. However, this method is very limiting when the curve is described with few points, as we have seen with experiments under high pressure conditions. In order to overcome this limit, recurrent in biology, we propose to use models to estimate growths parameters. Modeling has existed for many years to describe the growth behavior of microorganisms under variable physical and chemical conditions (Zwietering et al., 1990). Here we propose a ready-to-use application that do not require any special coding skills and allow retrieving several essential parameters describing microbial growth. his app aims at estimating the growth rate and maximum cells density using non-linear regression. The method is detailled in Martini et al. (2013). A demo dataset is available in "Download a demo dataset", you can save it in your computer and load it using "Browse", or you can also browse your own dataset. On Plot panel, it is possible to set axes labels, axes range and Smooth. Smooth parameter can compute theorical (downloadable) for to use with other activities. In order to run this application, you have to format your dataset with tabulation separators. Also, remove all spaces in the dataset header (prefer to use "_" when needed). Organise your dataset so that there is only two arrays. The first one being the time and the second one, the cells density (e. g. optic density, cell number, biomass). This application proposes a method to perform a logistic regression to estimate growth rate as well as maximum cells density . Citation: Garel, M., Izard, L., Vienne, M., Nerini, D., Tamburini, C., Martini, S. (2021). R-shiny-microorganisms v2 : A ready-to-use logistic regression implemented in R shiny to estimate growth parameters of microorganisms [Data set]. MIO UMR 7294 CNRS. https://doi.org/10.34930/DC1DAF1C-09E3-4829-8878-91D0BF0E643E
 OSU Pytheas - Data Catalog