 OSU Pytheas - Data Catalog
notPlanned
Type of resources
Available actions
Topics
INSPIRE themes
Keywords
Contact for the resource
Provided by
Formats
Representation types
Update frequencies
status
Scale
-

In the framework of the SNO/SOERE MOOSE (Mediterranean Ocean Observing System on Environment https://www.ir-ilico.fr/Les-reseaux-elementaires/Fiches-d-identite-des-reseaux-elementaires/MOOSE ) program, the Mediterranean Institute of Oceanography is operating coastal High Frequency Surface Wave Radars (HF radar) on the North Western Mediterranean coast. This activity is also supported by the following European Research Infrastructure Jerico-Next (https://www.jerico-ri.eu), and Intereg MED programs as Impact and Sicomar +. HF radar provide high resolution (3-5 km), synoptic view of surface currents from the shore up to 80 km off shore at hourly time scales. The measurement principle is based on the Doppler effect created by an additional current on the intrinsic speed of the waves selected by radar-sea interactions, called Bragg waves, having a wavelength of half that of the radar e.m. waves and propagating in the axis of observation (radial currents). A single radar scans the sea in azimuth and determines the radial components of the current at each adjacent cell along each azimuth. Two separate radars for the same area from different angles then collect the information necessary for mapping vector current from the combination of the two sets of radial components. The HF radar data set is made of monthly averaged surface currents, geo-referenced on cartesian lon/lat coordinates. The radial velocities maps are provided applying a Direction Finding technique (instead of traditional Beam Forming) not only to the full array of antenna but also to subarrays made of a smaller number of sequential antennas, a method which we refer to as "antenna grouping". Radials from Peyras-Peyras and Porquerolles-Benat are computed to reconstruct the vector field.
-
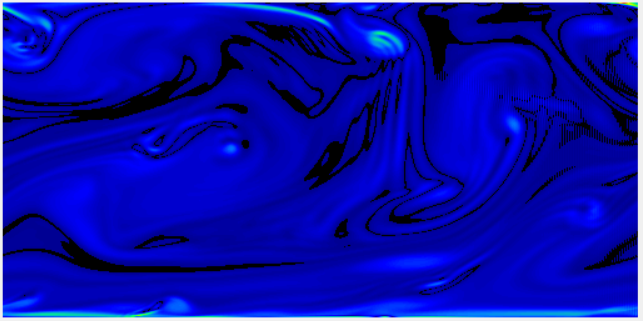
Wind is generated from left to right by an imposed constant horizontal pressure gradient. The initial wind field is disturbed by small random variations so as to produce a turbulent field. Withouth the perturbations, a viscous solution would be found. The numerical resolution technique used is based on finite differences, applied to a structured mesh. The Continuity and Navier-Stokes equations are solved with the well-known half time-step method, in which the Poisson equation is solved over the entire domain at each time iteration. As of 17 March 2022, the code version is DNS_2D_for_Teaching-v1.0.0. The code is written in C language. A GUI (Graphical User Interface) is available as an executable file "sdiapp.exe" that can be run under most versions of Microsoft Windows. Please just make sure to check the 'graph' box before clicking on the launch button, to have the visual experience. On the GUI, two graphs give an overview of the real time simulation. The top graph shows the 2D (x,z) vorticity, while the bottom graph shows the wind speed. The colour bars are not shown, but they are classical tables in which blue means small values, while red colours denote large values. The authors of this code version are Francis Vivat (LATMOS UMR CNRS 8190) and Denis Bourras (MIO UMR 7294). The code is distributed freely and comes with no garantees. It was mainly designed for educational purposes. Please note that the rules of use must follow the CeCILL-C FREE SOFTWARE LICENSE AGREEMENT included in the distribution. Any return is welcomed and encouraged, please contact francis.vivat@latmos.ipsl.fr or denis.bourras@mio.osupytheas.fr. Citation: Vivat, F., & Bourras, D., (2023). DNS_2D_for_Education [Application].
-
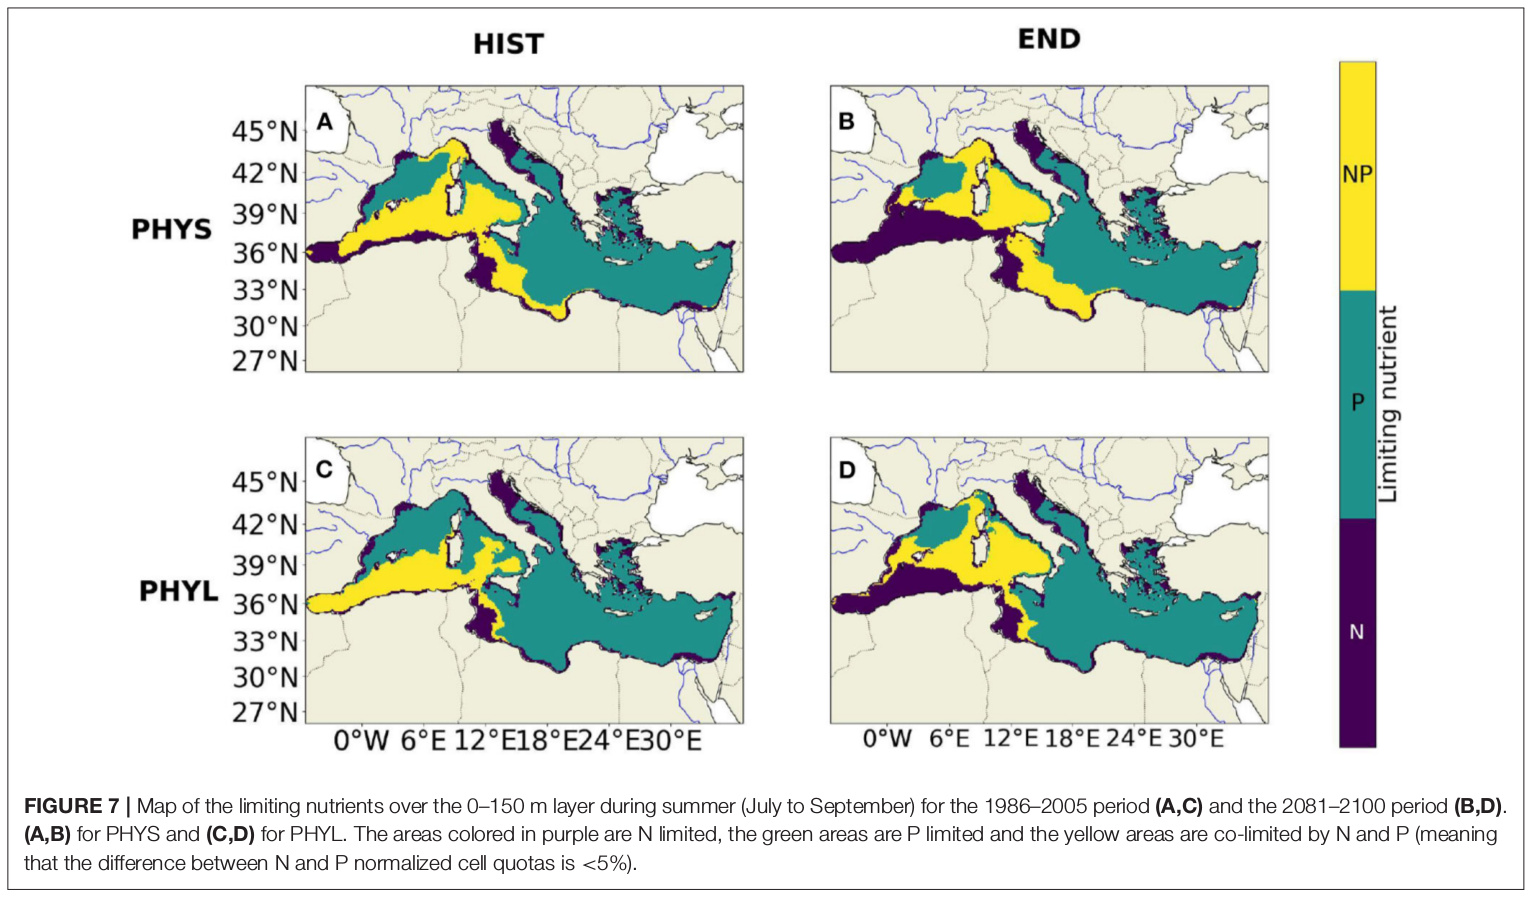
"Towards an integrated prediction of Land & Sea Responses to global change in the Mediterranean Basin" The LaSeR-Med project aims at investigating the effects of climate change and of mediterranean population growth on some major indicators of the Mediterranean Sea (primary production, carbon export, zooplankton biomass available for small pelagic fishes, pH, dissolved oxygen) using and integrated model encompassing a socio-economic model, a continental model of agro-ecosystems, and a physical ocean-atmosphere model coupled to a biogeochemical model of the ocean. Last, a model for the widespread species of jellyfish Pelagia Noctiluca (Berline et al., 2013) uses biogeochemical outputs as food forcing for the jellyfish. In this project, our aim was first to investigate the large-scale and long-term impacts of variations in river inputs on the biogeochemistry of the Mediterranean Sea over the last decades (see Pages et al., 2020a). In the second phase, a climate scenario (RCP8.5) alone (Pages et al., 2020b) or combined with a “land-use” scenario derived to ensure the same level of food availability as today in 2050 have been run to investigate its effect on these indicators and to analyze the observed changes on the structure and the functioning of planktonic food web. This interdisciplinary project provided the framework for joint discussions on each of the sub-models that constitute the integrated model, namely the socio-economic model (Ami et al., in prep., Mardesic et al., in prep.) created ex nihilo by researchers from AMSE, INRA and GREQAM, the continental agro-ecosystem model LPJmL (Bondeau et al., 2007) worked on at IMBE so as to include the nitrogen and phosphorous cycles in the frame of the present project, and the ocean biogeochemical model Eco3M-Med developed at MIO (Baklouti et al., 2006; Alekseenko et al. 2014, Guyennon et al., 2015; Pagès et al., 2020a), forced by ocean physics, either using the ocean model NEMO-Med12 forced by atmosphere at IPSL (simulation NM12-FREE run with the NEMO-MED12 model and used for our hindcast simulation, see below) or a coupled ocean-atmosphere model at CNRM (physical forcing provided by CNRM-RCSM4, see below). Details on the CNRM-RCSM4 model The CNRM-RCSM4 simulates the main components of the Mediterranean regional climate system and their interactions. It includes four different components: (i) The atmospheric regional model ALADIN-Climate (Radu et al., 2008; Colin et al., 2010; Herrmann et al., 2011) characterized by a 50 km horizontal resolution, 31 vertical levels, and a time step of 1800 s, (ii) the ISBA (Interaction between Soil Biosphere and Atmosphere) land-surface model (Noilhan and Mahfouf, 1996) at a 50 km horizontal resolution, (iii) the TRIP (Total Runoff Integrating Pathways) river routing model (Oki and Sud, 1998), used to convert the runoff simulated by ISBA into rivers (Decharme et al., 2010; Szczypta et al., 2012; Voldoire et al., 2013), and (iv) the Ocean general circulation model NEMO (Nucleus for European Modeling of the Ocean, Madec and NEMO-Team, 2016) in its NEMO-MED8 regional configuration (Beuvier et al., 2010). NEMO-MED8 is characterized by a horizontal resolution of 1/8° (grid cells size from 6 to 12 km), a vertical resolution of 43 vertical levels (cell height ranging from 6 to 200 m), and a time step of 1200 s. More details about the CNRM-RCSM4 model can be found in Sevault et al. (2014). Keywords: - Mediterranean Sea, river inputs, chlorophyll, nutrients, phytoplankton, bacteria, zooplankton, dissolved and particulate organic detrital matter Citation: Pagès, R., Baklouti, M., Barrier, N., Richon, C., Dutay, J.-C., and Moutin, T. (2020a). Changes in rivers inputs during the last decades significantly impacted the biogeochemistry of the eastern Mediterranean basin: a modelling study. Prog. Oceanogr. 181:102242. doi:10.1016/j.pocean.2019.102242 Pagès, R., Baklouti, M., Barrier, N., Ayache, M., Sevault, F., Somot, S. and Moutin, T. (2020b). Projected Effects of Climate-Induced Changes in Hydrodynamics on the Biogeochemistry of the Mediterranean Sea Under the RCP 8.5 Regional Climate Scenario. Front. Mar. Sci. 7:563615. doi:10.3389/fmars.2020.563615 Ayache, M., Bondeau, A., Pagès, R., Barrier, N., Ostberg, S. and Baklouti, M. (2020). LPJmL-Med – Modelling the dynamics of the land-sea nutrient transfer over the Mediterranean region–version 1: Model description and evaluation. Geoscientific Model Development Discussions, Copernicus Publ.
-
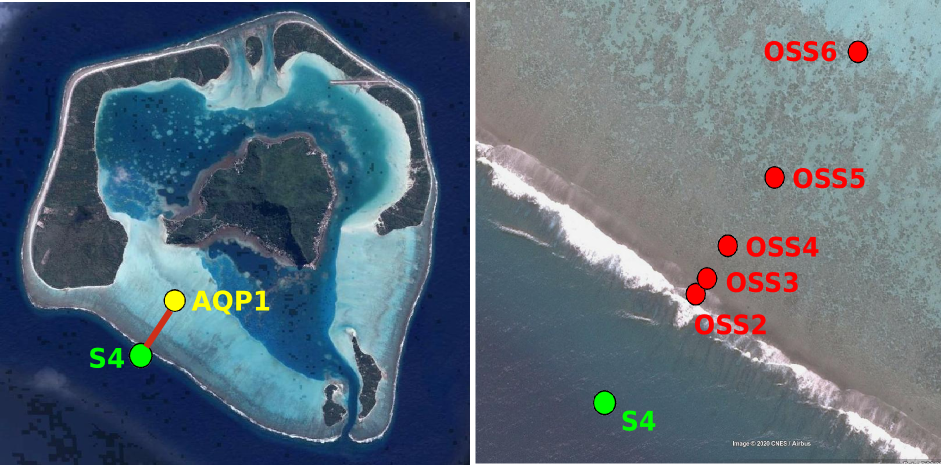
Maupiti ("the Stuck Twins'') is a diamond-shaped island located in the western part of the Society archipelago in French Polynesia. The present study focuses on the data recovered over a single cross-barrier transect located in the south-west barrier during the MAUPITI HOE field campaign, from 5 to 18 July 2018. The studied area is representative of the reef structure observed along the 4km-long southwestern barrier reef, showing an alongshore-uniform structure exposed to swell approaching with weak incident angles, a healthy reef colony. In the cross-barrier direction, the reef displays a clear partitioning of bottom roughness that ranges from low-crested compact structures at the reef crest to higher and sparser coral bommies on the backreef. The experimental setup was specifically designed to analyse and differentiate the dynamics over three roughness-contrasting sections found over the barrier reef. The scientific objectives of the project MAUPITI HOE are to understand the hydrodynamics of an archetypal reef-lagoon system of a high volcanic reef island. The physical functioning of the hydrosystem involves a fine coupling between water levels, waves (including wind, infragravity and VLF waves), currents and seabed structure (reef roughness). Four pressure sensors (OSS3, OSS4, OSS5, OSS6) have been deployed across the reef flat/ backreef, outside the surf zone. The bottom pressure is measured continuously at 10 Hz, and are converted into free surface elevation assuming hydrostaticity. An electrocurrent meter S4 provides the wave forcing while AQP1 is a velocity profiler providing the transports. The bed profile is obtained from the combination of (I) boat survey in the deeper part and (ii) high resolution GNSS RTK topography by feet. Two datasets are available: one is concerning the mean parameters linked to the reef barrier dynamics, and the second dataset is concerning the wave friction.
-
The scientific objectives of the project MAUPITI HOE are to understand the hydrodynamics of an archetypal reef-lagoon system of a high volcanic reef island. The physical functioning of the hydrosystem involves a fine coupling between water levels, waves (including wind, infragravity and VLF waves), currents and seabed structure (reef roughness). The present data focuses on the reef barrier dynamics. Citation: - Sous D., Bouchette F., Certain R., Meulé S. (2021). Maupiti Hoe 2018 [Data set]. MIO UMR 7294 CNRS, GLADYS. https://doi.org/10.34930/9DB3BEC4-0BBF-4531-8864-F100C4B8ECED
-

This Application is a simple calculator that estimates Turbulent Air-Sea Fluxes based on input variables such as wind speed, air temperature, or relative humidity. The input variables can be easily set by hand with sliders. The present Air-Sea Flux Calculator application makes it easy to get an estimate of the fluxes at Sea of for Educational purposes The code is a simplification of the well known bulk algorithm so-called COARE 3.0 (Fairall et al. 2003). The authors of this code are Nicolas Bourras and Denis Bourras (MIO CNRS UMR 7294, Institut Méditerranéen d'Océanologie, Institut Pytheas CNRS UAR 3470, Aix-Marseille University). Citation: Bourras, N., & Bourras, D., (2023). Air-Sea flux calculator [Application].
-
Maupiti ("the Stuck Twins'') is a diamond-shaped island located in the western part of the Society archipelago in French Polynesia. The present study focuses on the data recovered over a single cross-barrier transect located in the south-west barrier during the MAUPITI HOE field campaign, from 5 to 18 July 2018. The studied area is representative of the reef structure observed along the 4km-long southwestern barrier reef, showing an alongshore-uniform structure exposed to swell approaching with weak incident angles, a healthy reef colony. In the cross-barrier direction, the reef displays a clear partitioning of bottom roughness that ranges from low-crested compact structures at the reef crest to higher and sparser coral bommies on the backreef. The experimental setup was specifically designed to analyse and differentiate the dynamics over three roughness-contrasting sections found over the barrier reef. Four pressure sensors (OSS3, OSS4, OSS5, OSS6) have been deployed across the reef flat/ backreef, outside the surf zone. The bottom pressure is measured continuously at 10 Hz, and are converted into free surface elevation assuming hydrostaticity. An electrocurrent meter S4 provides the wave forcing while AQP1 is a velocity profiler providing the transports. The bed profile is obtained from the combination of (I) boat survey in the deeper part and (ii) high resolution GNSS RTK topography by feet. S4 position : -16.47109°N; -152.2782°E OSS3 position: -16.46968°N; -152.27698°E OSS4 position : -16.46931°N; -152.27676°E OSS5 position : -16.46851°N;-152.27614°E OSS6 position: -16.46706°N; -152.27504°E AQP1 position: -16.46318°N ; -152.27348°E
-
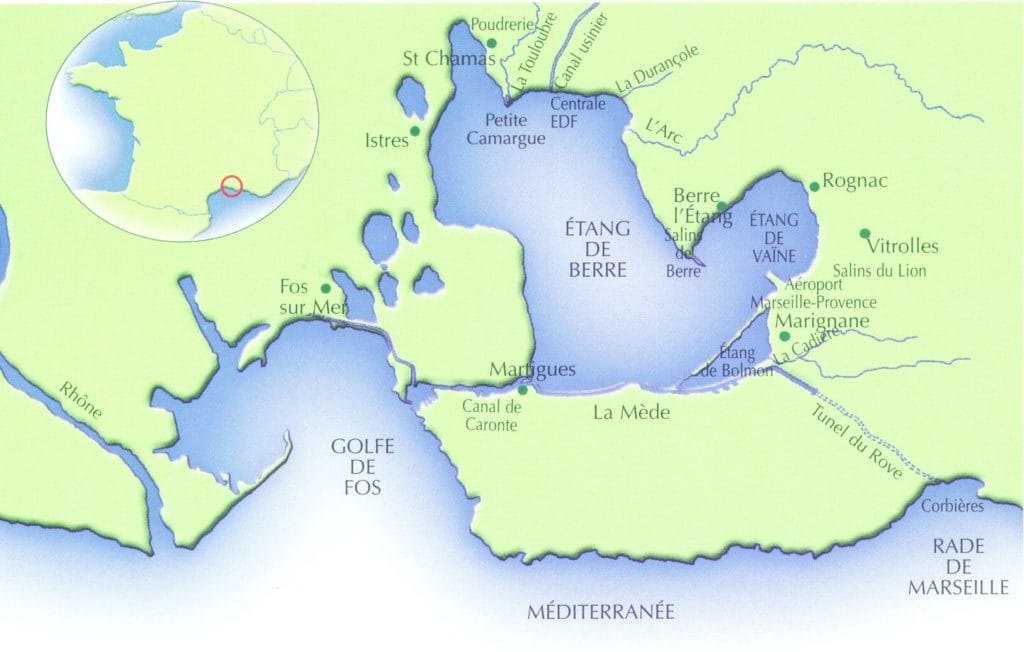
L’Observatoire du milieu porté par le GIPREB (Groupement d’Intérêt Publique pour la Réhabilitation de l’Etang de Berre) a pour vocation de suivre depuis 1994 l’évolution hydrologique et biologique de l’étang de Berre (France, Méditerranée). Prélèvement mensuellement en 10 stations de l’étang de Berre au fond et en surface. ================================================================= * Paramètres : Sels nutritifs (NO3, NO2, PO4) ; Ammonium (NH4) ; Ptot/Ntot ; COP/NOP (carbone et azote particulaire); Pigments (Chla/Phéo) ; MES (matières en suspension) * Date de début de la série : juin 1994 * Prélèvement : Bouteille Niskin. Opérateur : GIPREB *Analyse Opérateur : Mediterranean Institute of Oceanography (MIO UMR 7294 CNRS) - Méthode NO3, NO2, PO4 : Colorimétrie (Analyseur automatique) - Méthode NH4+ : Dosage par Fluorimétrie - Méthode Chla/Phéo : Filtration et Fluorimétrie - Méthode COP/NOP (carbone et azote organique particulaire) : Filtration et Analyseur élémentaire - Méthode MES (matiere en suspension) : Filtration et Pesée Autres données HF disponibles au point H12 : Oxygène, Salinité, Température au milieu-fond-surface depuis 2020
-
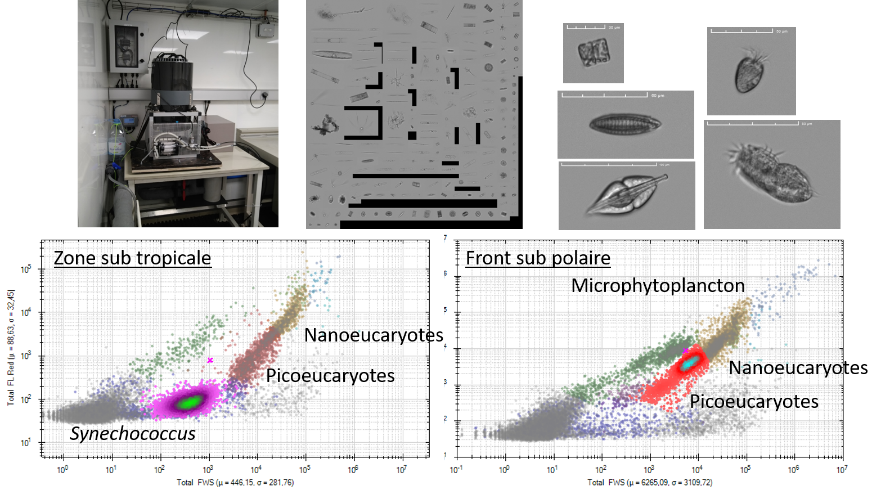
The MAP-IO (Marion Dusfresne Atmospheric Program - Indian Ocean) program aims to make up for the lack of observation in this region of the earth by equipping the Marion Dufresne vessel (https://taaf.fr/en/marion-dufresne-and-astrolabe/) with a set of in-situ instruments and remote sensing for the atmosphere and marine biology studies. This program has been labeled by the French Commission Nationale de la Flotte Hauturière (CNFH, https://www.flotteoceanographique.fr/) for the period 2021 to 2024. During this period, MAP-IO will operate as a scientific program for the acquisition and scientific enhancement of four years of data. This period will also serve as an operational prototype to study the feasibility of switching the program to a permanent observatory aimed at integration into international infrastructures networks such as ACTRIS (https://www.actris.eu/) or ICOS (https://www.icos-cp.eu/). - more informations on the project : http://www.mapio.re/ The Cytosense automated flow cytometer from the cytobuoy compagny was installed onboard the Marion Dufresnes Sea Water supply, to run semi continuously samples for phytoplankton functional groups resolution. Sample acquisition was schedulled once avery two hours. The data corresponds to abundances in cells/ml, mean forward scatter and red fluorescence in arbitrary units, per group. The groups are identified as standard groups following the BODC F02 vocabulary and the corresponding selections sets named following expert names.
-
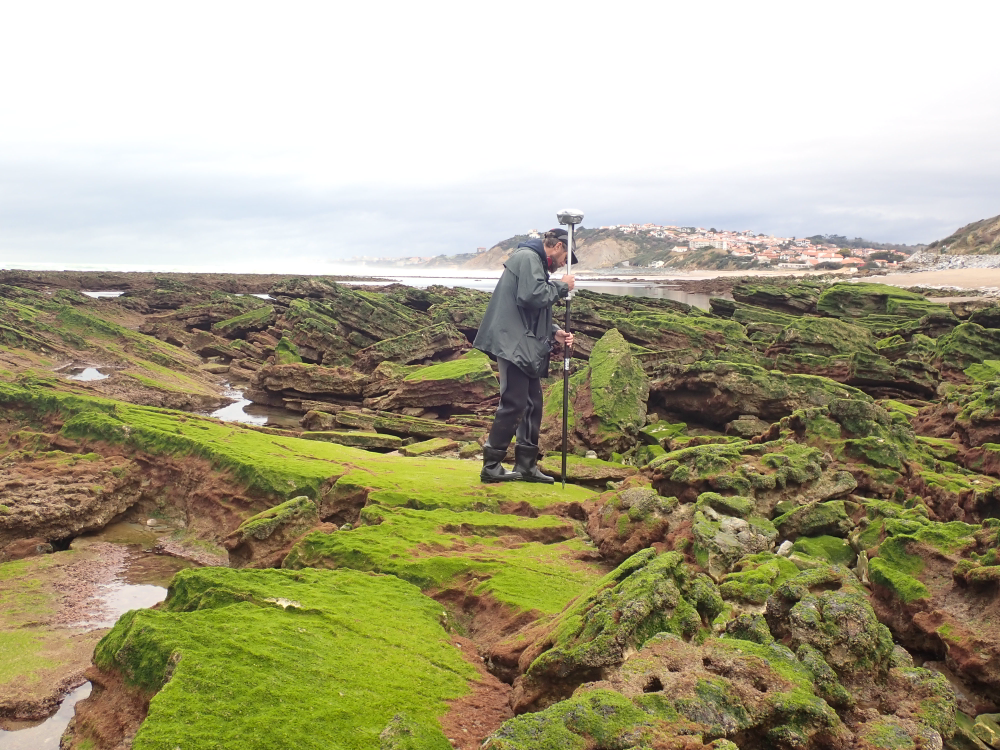
The present dataset is based on a nine site study of fine seabed topography in intertidal zones. Four coral sites (Maupiti A, B and C and Niau islands) and five rocky sites (Ars en Ré, Socoa, Parlementia A and B and Banneg island) have been explored. The data has been gathered using on-foot GNSS RTK for all sites (Trimble R8/R8S and Leica sytems) except Banneg island, where aerial Lidar data from Litto3D program has been used. The horizontal resolution varies between 3.8 and 12cm allowing to describe a wide range of spatial scales (generally over 3 spectral decades). The data has been processed to explore the statistical and spectral metrics which can be used to characterize the architectural complexity of seabeds. Owners: - Topographic survey on Ars-en-Ré : profile X, Z in meter along a transec was operated on 10-15 Jan 2021 with On-foot Trimble R8/R8S GNSS RTK by Shom, Gladys and Univ. de Montpellier - Topographic survey on Maupiti Hoe: profile X, Z in meter along a transec was operated on 5-10 July 2018 with on-foot Trimble R8/R8S GNSS RTK by GLADYS and Université de Montpellier - Topographic survey on Niau : profile X, Z in meter along a transec operated on 10 Nov. 2021 with On-foot Trimble R8/R8S GNSS RTK - by CEREGE and MIO (OSU Pytheas) - Topographic survey on Parlementia A, and B : profile X, Z in meter along a transec was operated on 22 Fev 2023 with on-foot Leica GNSS RTK by SIAME, UPPA - Topographic survey on Socoa : profile X, Z in meter along a transec was operated on 21 Fev 2023 with on-foot Leica GNSS RTK by SIAME, UPPA and Shom - Topographic survey in high resolution of Banneg island (X, Y, Z) is made by aerial lidar litto3D on spring 2012/2013 by Shom and IGN